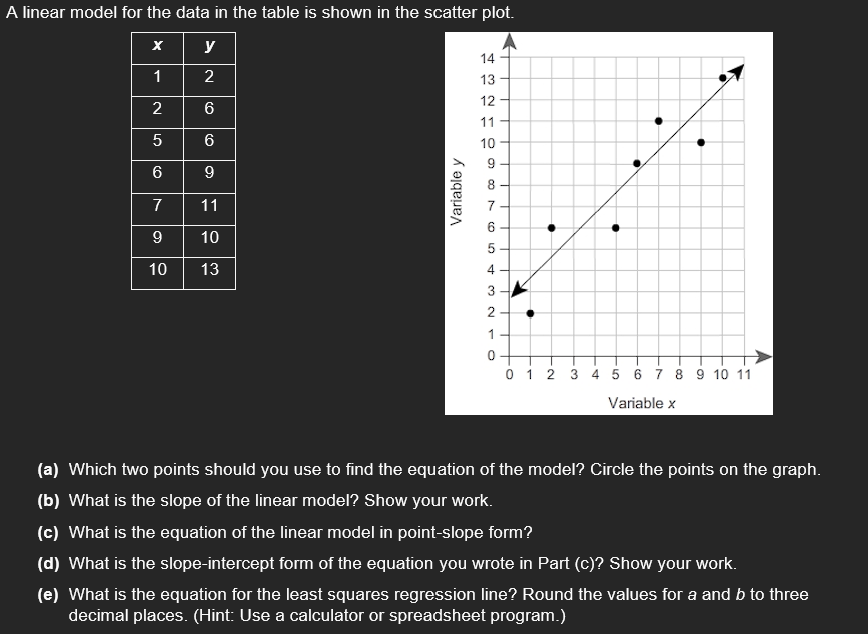
Question: A linear model for the data in the table is shown in the scatter plot. oomwk 8 7 G 5 4 3 2 1 O

A linear model for the data in the table is shown
A linear model for the data in the table is shown in the scatter plot. oomwk 8 7 G 5 4 3 2 1 O 234567891011 Variable x (a) Which two points should you use to nd the equation of the model? Circle the points on the graph. (b) What is the slope of the linear model? Show your work. to) What is the equation of the linear model in pointslope form?I (d) What is the slopeeintercept form of the equation you wrote in Part (c)? Show your work. (9) What is the equation for the least squares regression line? Round the values for a and b to three decimal places. (Hint: Use a calculator or spreadsheet program.)

Step by Step Solution

There are 3 Steps involved in it

1 Expert Approved Answer
Step: 1 Unlock blur-text-image
Question Has Been Solved by an Expert!

Get step-by-step solutions from verified subject matter experts

Step: 2 Unlock
Step: 3 Unlock

Students Have Also Explored These Related Mathematics Questions!