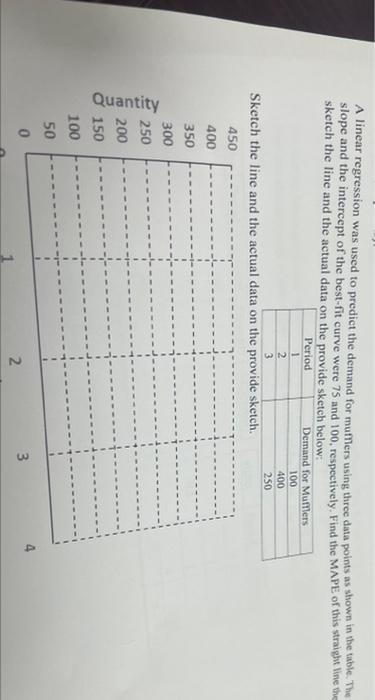
Question: A linear regression was used to predict the demand for mufflers using three data points as shown in the table. The slope and the intercept

A linear regression was used to predict the
A linear regression was used to predict the demand for mufflers using three data points as shown in the table. The slope and the intercept of the best-fit curve were 75 and 100, respectively. Find the MAPE of this straight line the sketch the line and the actual data on the provide sketch below: Period Demand for Mumers 1 2 3 Sketch the line and the actual data on the provide sketch. 450 100 400 250 400 350 300 250 Quantity 200 150 100 50 0 3 4 N

Step by Step Solution

There are 3 Steps involved in it

1 Expert Approved Answer
Step: 1 Unlock blur-text-image
Question Has Been Solved by an Expert!

Get step-by-step solutions from verified subject matter experts

Step: 2 Unlock
Step: 3 Unlock

Students Have Also Explored These Related General Management Questions!