

A local distributor of t-shirts has experienced increasing demand. The table below includes monthly demand data for
Question:
A local distributor of t-shirts has experienced increasing demand. The table below includes monthly demand data for one year. Month JAN FEB MAR APR MAY JUN JUL AUG SEP OCT NOV DEC Demand 857 921 1,071 1,133 1,209 1,234 1,262 1,258 1,175 1,174 1,123 1,159 a. Develop a trend model using the demand data provided. [10 points] b. Forecast demand for January through December of the following year using the trend model developed in part a. [10 points] 4. You work for a consulting company that is attempting to improve its forecasting methodology. They provided you with the following demand and forecast data. The data represents six periods. Your first step is to better understand the accuracy of their current forecasting method by calculating performance metrics to benchmark the current state and compare it to your eventual solution. Period Demand Forecast 1 750 725 2 44 46 3 120 125 4 225 240 5 350 375 6 2500 2625 a. Calculate the mean percent error for the data provided. [5 points] b. Calculate the mean absolute percent error for the data provided. [5 points] c. Calculate the mean absolute percentage error for the data provided. [5 points] d. Compare and contrast your results in parts a-c.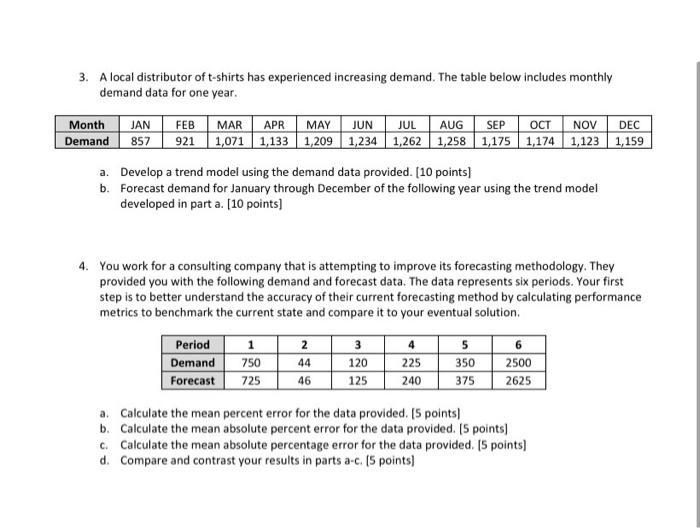
Expert Answer:


Operations Management
ISBN: 9781259270154
6th Canadian Edition
Authors: William J Stevenson, Mehran Hojati, James Cao
