

Question: A local medical testing lab, has noticed that demand for its blood tests from walk-in customers has gone up over the last 16 weeks. It
A local medical testing lab, has noticed that demand for its blood tests from walk-in customers has gone up over the last 16 weeks. It appears to have been caused by media hype around a diet, that involves people picking food based on their lipid profile.
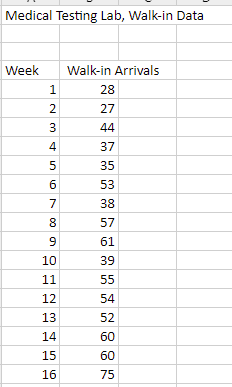
The manager of the lap wants to forecast the # of walk-in arrivals for next week to better schedule resources. Data for the last 16 weeks of walk-ins for blood tests has been tabulated below. Data prior to that is not useful, as the current diet hype was not present before that.
Plot the data on an appropriate chart in Excel and visually inspect it for presence of a trend. What do you see:
| A positive trend |
| A negative trend |
| No trend |
| Medical data should not be checked for trends, as that is relevant to consumer marketing data only.
|
A) Use regression to forecast the # of walk-in arrivals for week 17. Round your answer to the nearest integer.
B) What is the R2 (r squared) for the regression forecasting model?
Do not type in the % sign, and enter your answer to 2 decimal places on a scale of 0 to 100. E.g. R2 of 0.2314 will be entered as 23.14
C) What is the MAPE for your regression model (computed over weeks 1 to 16)?
Do not type in the % sign, and enter your answer to 2 decimal places on a scale of 0 to 100. E.g. A MAPE of 5.32% will be entered as simply 5.32.
Medical Testing Lab, Walk-in Data Walk-in Arrivals 28 27 44 37 35 Week 1 2 3 4 5 6 7 8 9 10 11 12 13 53 38 57 61 39 55 54 52 60 14 60 15 16 75
Step by Step Solution
There are 3 Steps involved in it

Get step-by-step solutions from verified subject matter experts