

Question: A MA336 Spring 2022 Practice TES X + - C webassign.net/web/Student/Assignment-Responses/submit?pos=1&dep=29081386&tags=autosave#question4333053_1 M Gmail YouTube 9 Maps Living Environment.. The accompanying scatterplot shows observations on hemoglobin
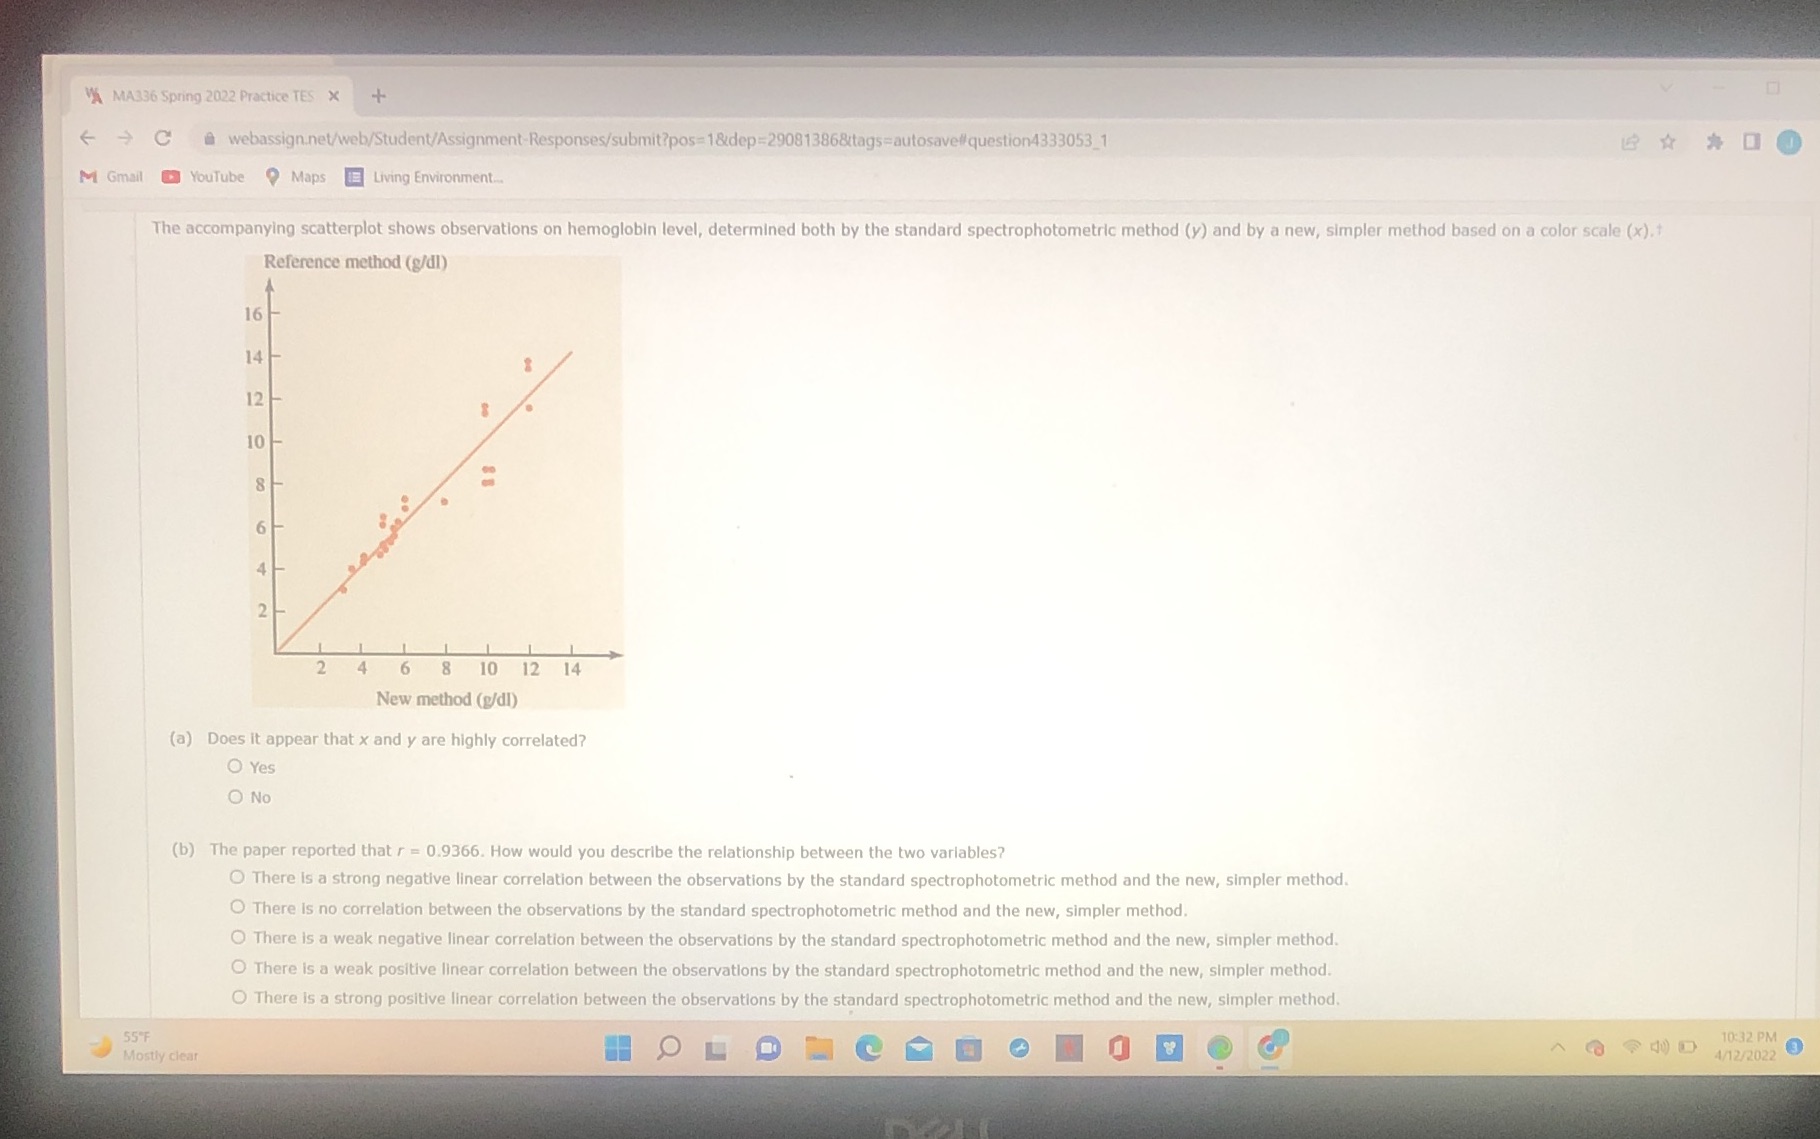
A MA336 Spring 2022 Practice TES X + - C webassign.net/web/Student/Assignment-Responses/submit?pos=1&dep=29081386&tags=autosave#question4333053_1 M Gmail YouTube 9 Maps Living Environment.. The accompanying scatterplot shows observations on hemoglobin level, determined both by the standard spectrophotometric method (y) and by a new, simpler method based on a color scale (x). Reference method (g/dl) 16 14/ 12 10 8 6 A 2 4 8 10 12 14 New method (/dl) (a) Does it appear that x and y are highly correlated? Yes O No (b) The paper reported that r = 0.9366. How would you describe the relationship between the two variables? O There is a strong negative linear correlation between the observations by the standard spectrophotometric method and the new, simpler method. O There is no correlation between the observations by the standard spectrophotometric method and the new, simpler method. There is a weak negative linear correlation between the observations by the standard spectrophotometric method and the new, simpler method. There is a weak positive linear correlation between the observations by the standard spectrophotometric method and the new, simpler method. There is a strong positive linear correlation between the observations by the standard spectrophotometric method and the new, simpler method. 55 F 10:32 PM Mostly clear 4/12/2022
Step by Step Solution
There are 3 Steps involved in it

Get step-by-step solutions from verified subject matter experts