

Question: (a) Make a histogram using the class boundaries 53.5, 99.5, 145.5, 191.5, 237.5, 283.5. 40 99.5 40 53.5 36 36 32 28 24 Salaries Salaries

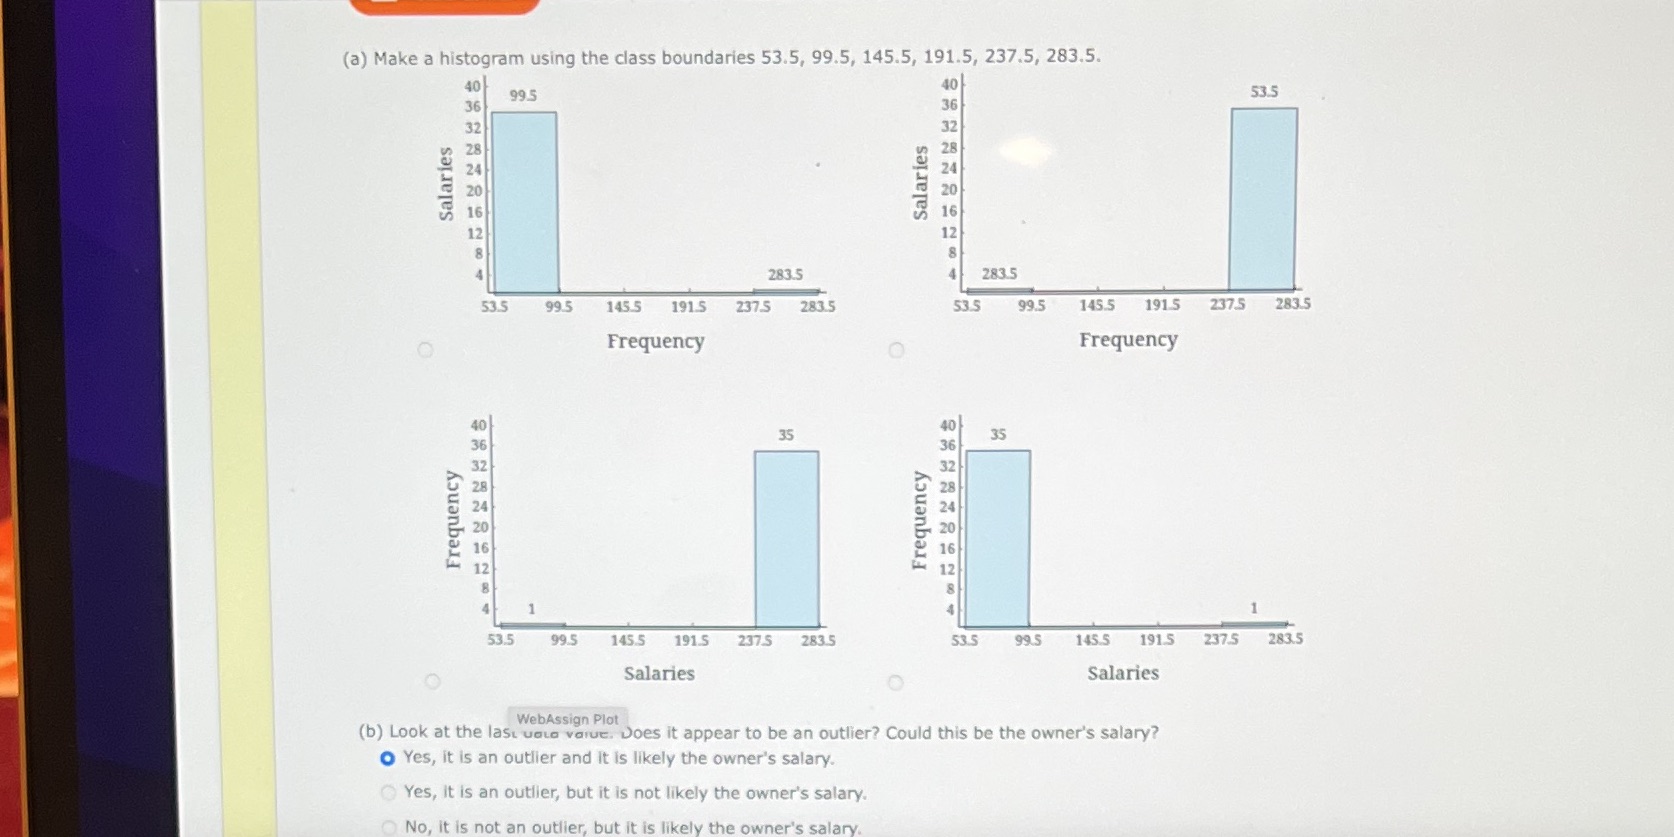
(a) Make a histogram using the class boundaries 53.5, 99.5, 145.5, 191.5, 237.5, 283.5. 40 99.5 40 53.5 36 36 32 28 24 Salaries Salaries 20 16 12 283.5 283.5 53.5 99.5 145.5 191.5 237.5 283.5 53.5 99.5 145.5 191.5 237.5 283.5 O Frequency O Frequency 35 35 Frequency Frequency 53.5 99.5 145.5 191.5 237.5 283.5 53.5 99.5 145.5 191.5 237.5 283.5 O Salaries O Salaries WebAssign Plot (b) Look at the last uata value. Does it appear to be an outlier? Could this be the owner's salary? O Yes, it is an outlier and it is likely the owner's salary. Yes, it is an outlier, but it is not likely the owner's salary. No, it is not an outlier, but it is likely the owner's salary
Step by Step Solution
There are 3 Steps involved in it

Get step-by-step solutions from verified subject matter experts