

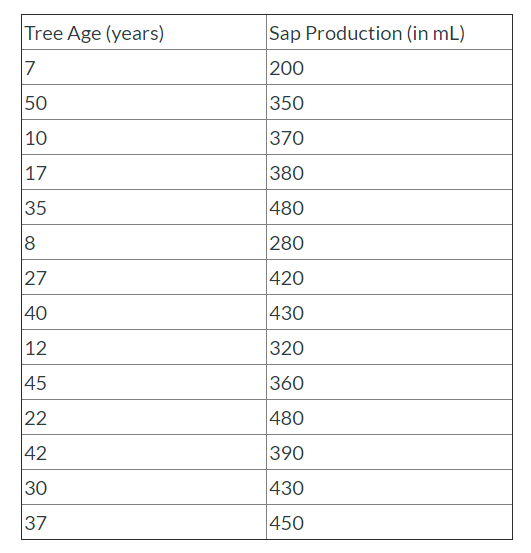
Question: a. Make scatterplot of the above data using age as the explanatory variable. Describe the relationship you see based on the scatterplot b. determine the
a. Make scatterplot of the above data using age as the explanatory variable. Describe the relationship you see based on the scatterplot
b. determine the linear regression equation for the data
c. determine the correlation coefficient for the data
d. Interpret the slope of the equation in context of the problem
e. Interpret the y-intercept of the equation in context of the problem. Is this interpretation appropriate?
f. Use the regression equation to approximate the sap production of a tree that is 45 years old. How does this value compare the collected data
\f
Step by Step Solution
There are 3 Steps involved in it
1 Expert Approved Answer
Step: 1 Unlock

Question Has Been Solved by an Expert!
Get step-by-step solutions from verified subject matter experts
Step: 2 Unlock
Step: 3 Unlock