

Question: A mathematics teacher wanted to see the correlation between test scores and homework. The homework grade (x) and test grade (y) are given in the
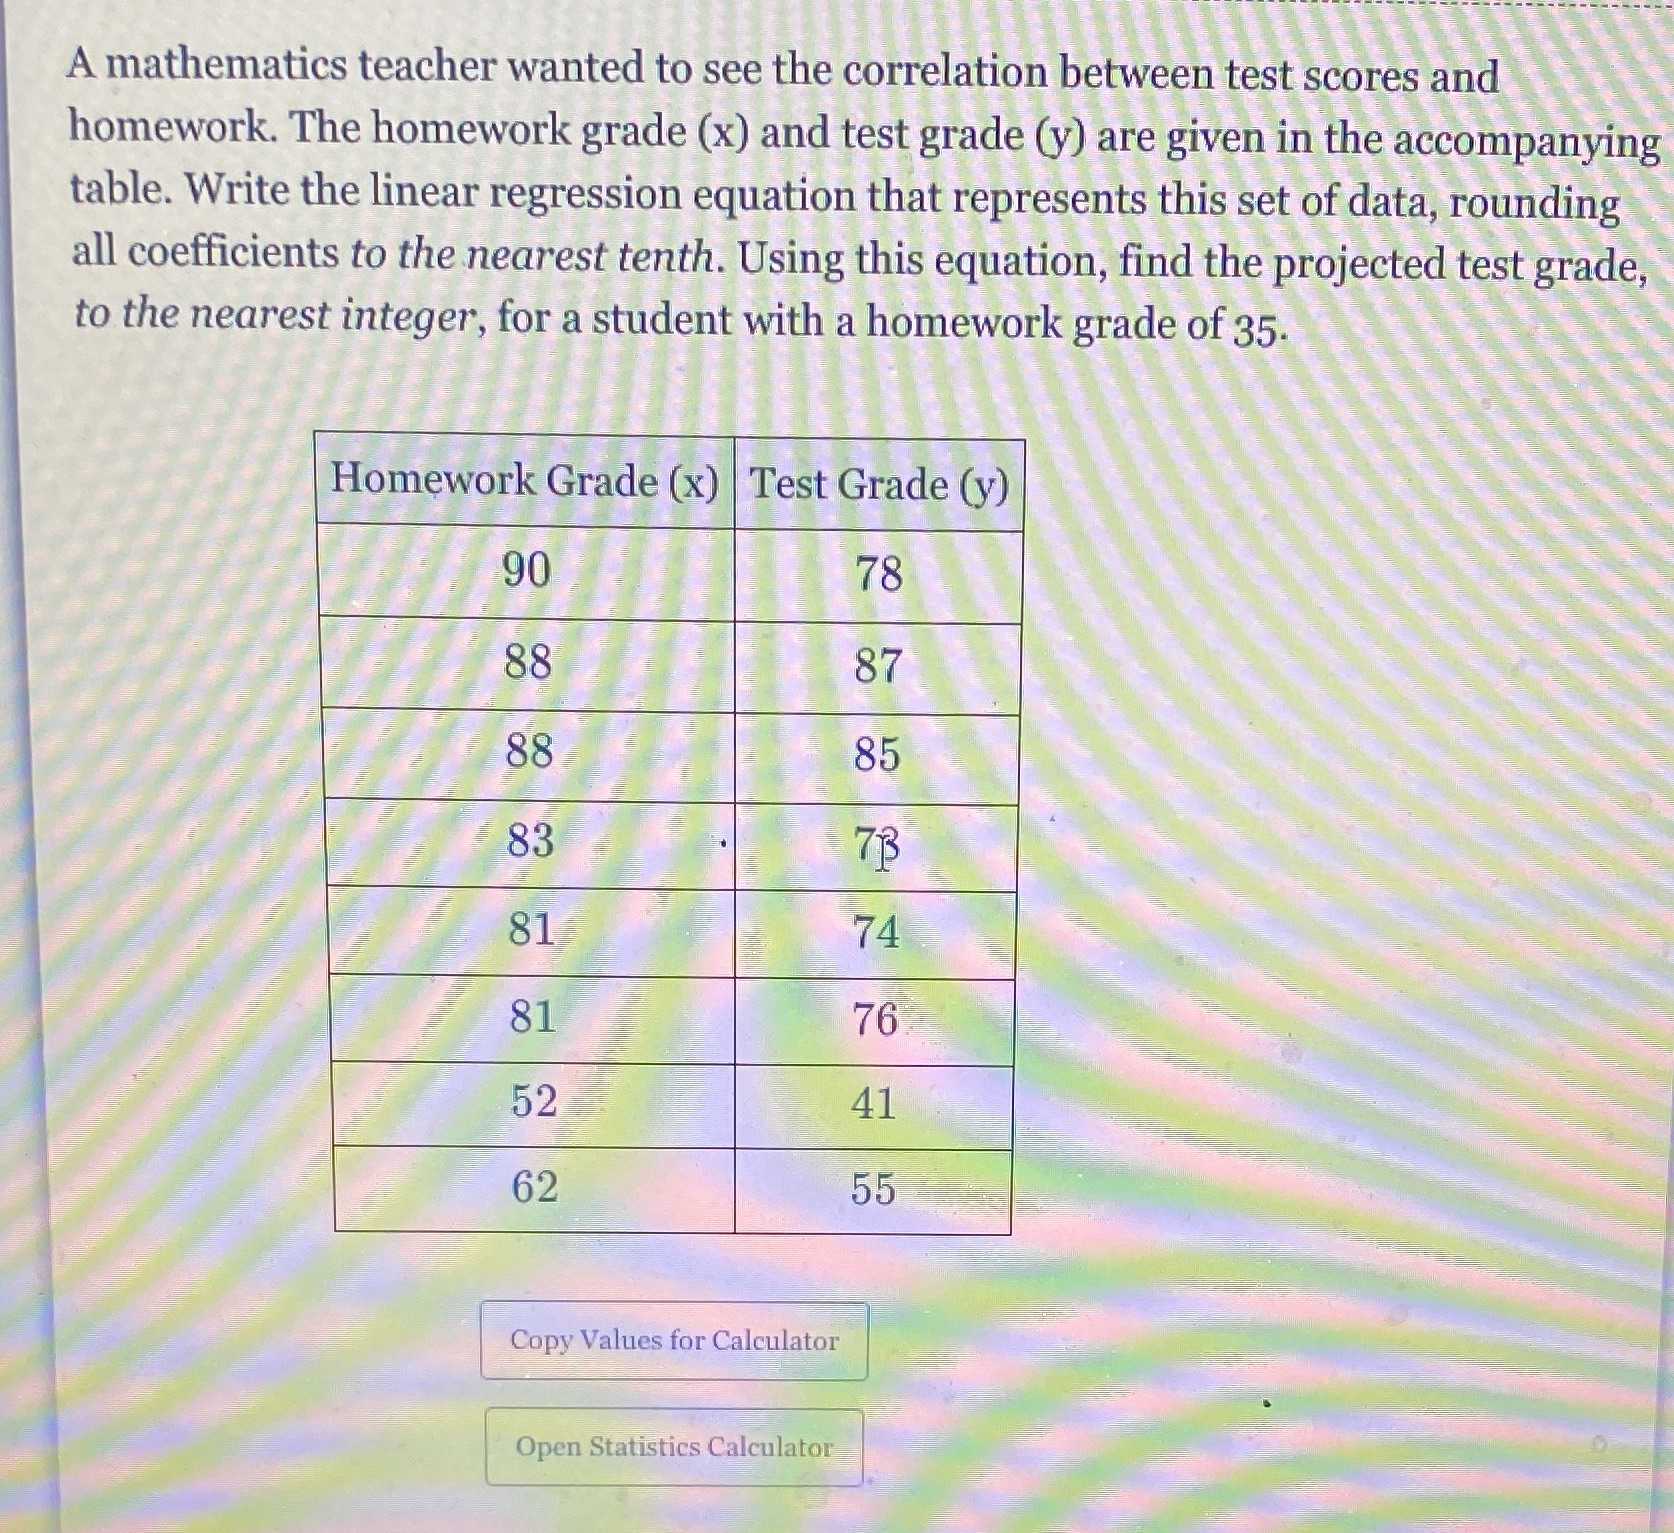
A mathematics teacher wanted to see the correlation between test scores and homework. The homework grade (x) and test grade (y) are given in the accompanying table. Write the linear regression equation that represents this set of data, rounding all coefficients to the nearest tenth. Using this equation, find the projected test grade, to the nearest integer, for a student with a homework grade of 35. Homework Grade (x) | Test Grade (y) 90 78 88 87 88 85 83 81 74 81 76 52 41 62 55 Copy Values for Calculator Open Statistics Calculator
Step by Step Solution
There are 3 Steps involved in it
1 Expert Approved Answer
Step: 1 Unlock

Question Has Been Solved by an Expert!
Get step-by-step solutions from verified subject matter experts
Step: 2 Unlock
Step: 3 Unlock