

Question: A mechanical system is presented as below. There are four simulation graphs for different values for m, b and c tested for a step
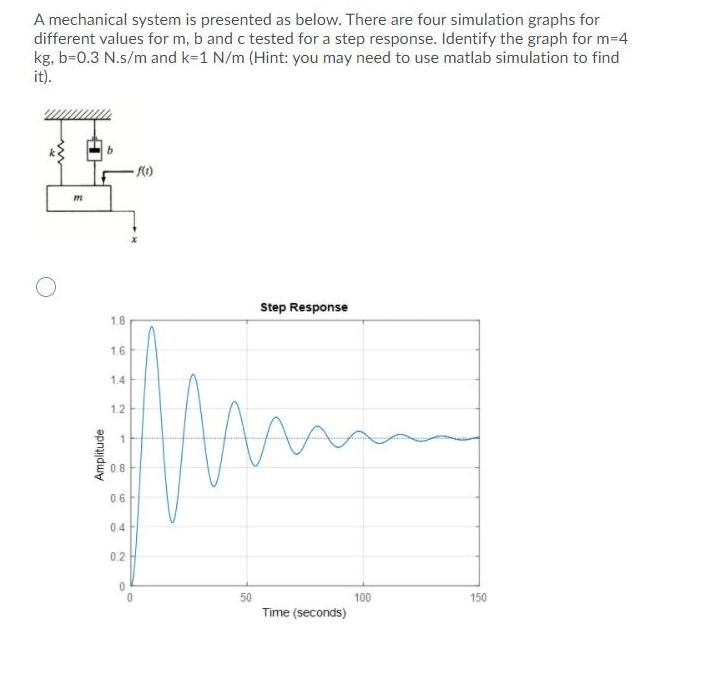
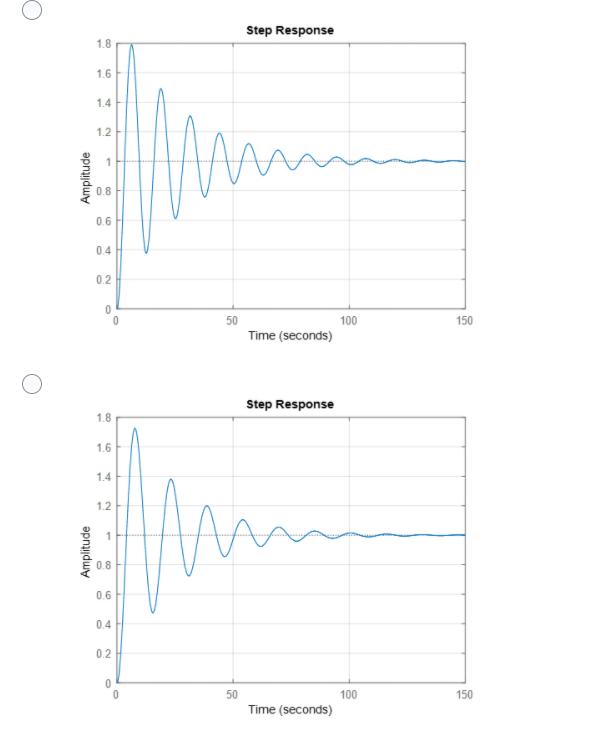
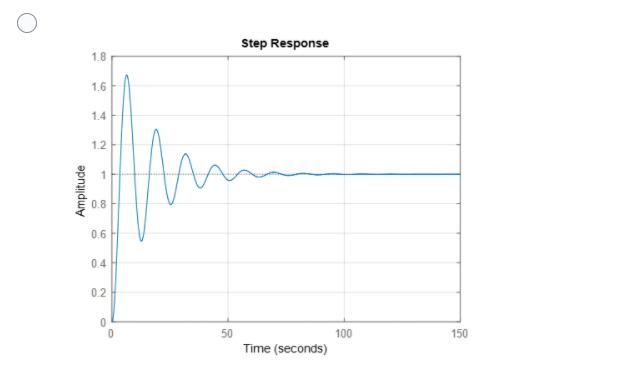
A mechanical system is presented as below. There are four simulation graphs for different values for m, b and c tested for a step response. Identify the graph for m=4 kg, b=0.3 N.s/m and k-1 N/m (Hint: you may need to use matlab simulation to find it). E Amplitude 1.8 1.6 1.4 1.2 0.8 0.6 0.4 0.2 0 f(1) 0 50 Step Response Time (seconds) 100 150 Amplitude Amplitude 1.8 1.6 1.4 1.2 - 0.8 0.6 0.4 0.2 0 1.8 1.6 1.4 1.2 - 0.8 0.6 0 0.4 0.2 0 O M 50 Step Response 50 Time (seconds) Step Response m Time (seconds) 100 100 150 150 Amplitude 1.8 1.6 1.4 1.2 - 0.8 0.6 0.4 0.2 0 0 50 Step Response Time (seconds) 100 150
Step by Step Solution
3.45 Rating (158 Votes )
There are 3 Steps involved in it
I ... View full answer

Get step-by-step solutions from verified subject matter experts