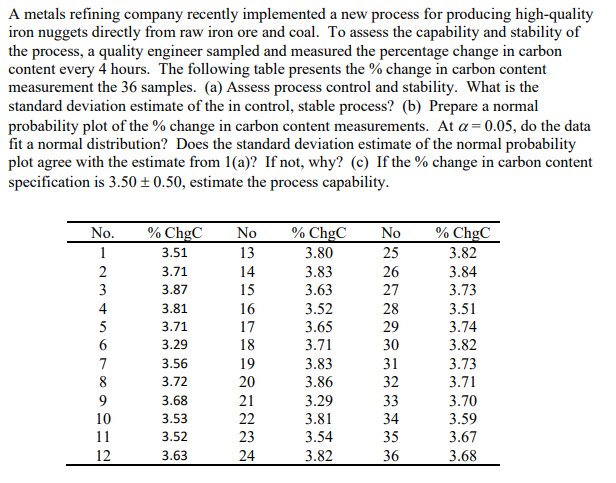
Question: A metals refining company recently implemented a new process for producing high-quality iron nuggets directly from raw iron ore and coal. To assess the capability

A metals refining company recently implemented a

A metals refining company recently implemented a new process for producing high-quality iron nuggets directly from raw iron ore and coal. To assess the capability and stability of the process, a quality engineer sampled and measured the percentage change in carbon content every 4 hours. The following table presents the % change in carbon content measurement the 36 samples. (a) Assess process control and stability. What is the standard deviation estimate of the in control, stable process? (6) Prepare a normal probability plot of the change in carbon content measurements. At a=0.05, do the data fit a normal distribution? Does the standard deviation estimate of the normal probability plot agree with the estimate from 1(a)? If not, why? (c) If the % change in carbon content specification is 3.50 +0.50, estimate the process capability. No. 1 2 3 4 5 6 7 8 9 10 11 12 % ChgC 3.51 3.71 3.87 3.81 3.71 3.29 3.56 3.72 3.68 3.53 3.52 3.63 No 13 14 15 16 17 18 19 20 21 22 23 24 % ChgC 3.80 3.83 3.63 3.52 3.65 3.71 3.83 3.86 3.29 3.81 3.54 3.82 No 25 26 27 28 29 30 31 32 33 34 35 36 % ChgC 3.82 3.84 3.73 3.51 3.74 3.82 3.73 3.71 3.70 3.59 3.67 3.68 A metals refining company recently implemented a new process for producing high-quality iron nuggets directly from raw iron ore and coal. To assess the capability and stability of the process, a quality engineer sampled and measured the percentage change in carbon content every 4 hours. The following table presents the % change in carbon content measurement the 36 samples. (a) Assess process control and stability. What is the standard deviation estimate of the in control, stable process? (6) Prepare a normal probability plot of the change in carbon content measurements. At a=0.05, do the data fit a normal distribution? Does the standard deviation estimate of the normal probability plot agree with the estimate from 1(a)? If not, why? (c) If the % change in carbon content specification is 3.50 +0.50, estimate the process capability. No. 1 2 3 4 5 6 7 8 9 10 11 12 % ChgC 3.51 3.71 3.87 3.81 3.71 3.29 3.56 3.72 3.68 3.53 3.52 3.63 No 13 14 15 16 17 18 19 20 21 22 23 24 % ChgC 3.80 3.83 3.63 3.52 3.65 3.71 3.83 3.86 3.29 3.81 3.54 3.82 No 25 26 27 28 29 30 31 32 33 34 35 36 % ChgC 3.82 3.84 3.73 3.51 3.74 3.82 3.73 3.71 3.70 3.59 3.67 3.68

Step by Step Solution

There are 3 Steps involved in it

1 Expert Approved Answer
Step: 1 Unlock

a Assess Process Control and Stability To assess the stability of the process we need to check the standard deviation estimate of the process The key steps are 1 Calculate the mean of the percentage c... View full answer

blur-text-image
Question Has Been Solved by an Expert!

Get step-by-step solutions from verified subject matter experts

Step: 2 Unlock
Step: 3 Unlock

Students Have Also Explored These Related General Management Questions!