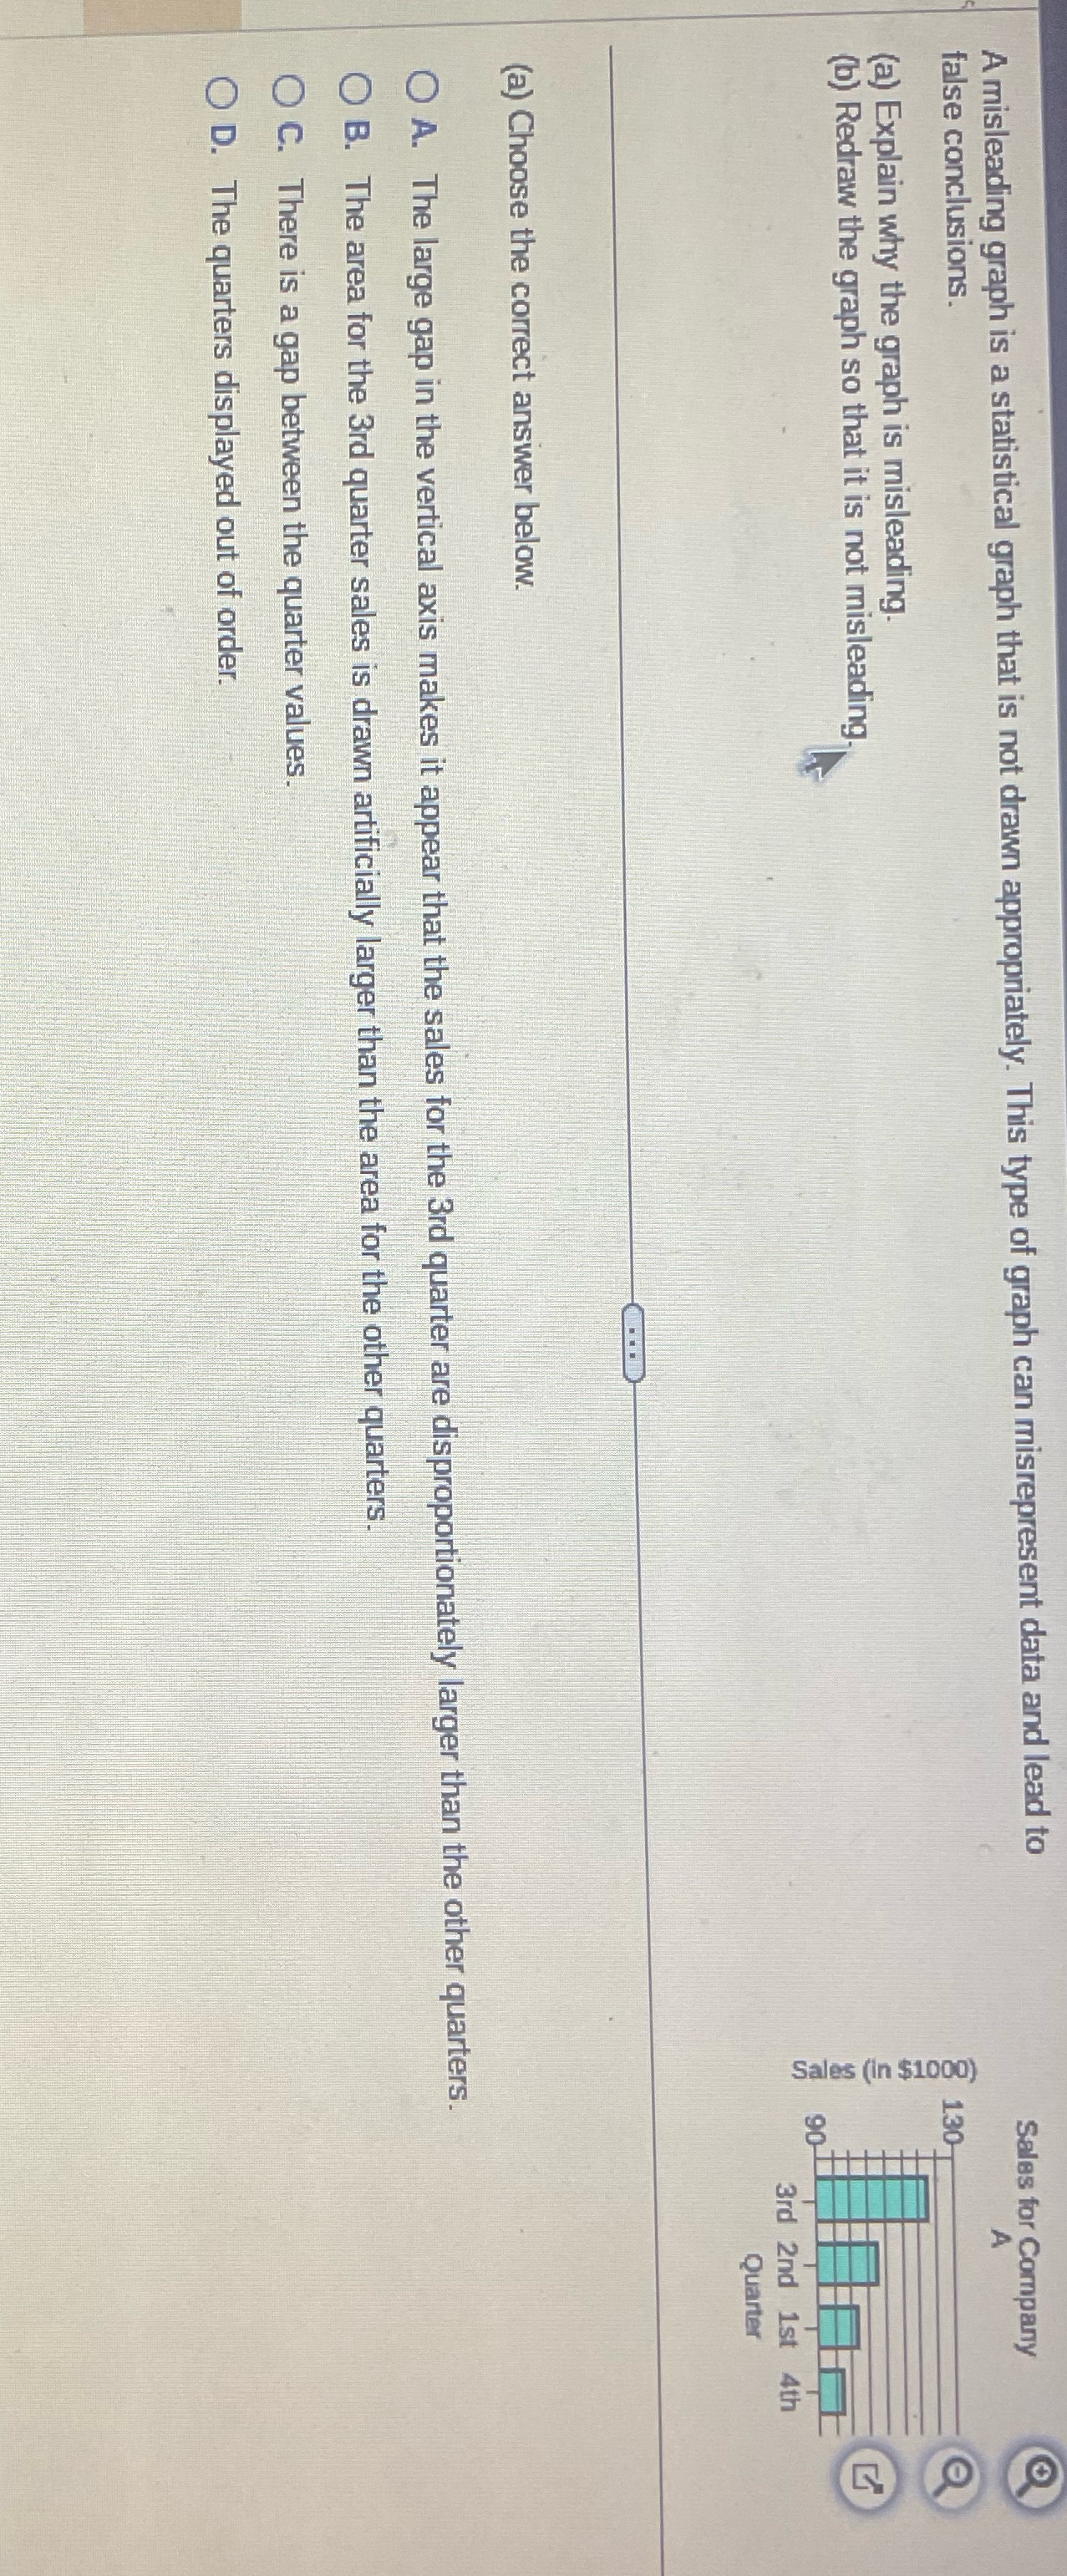
Question: A misleading graph is a statistical graph that is not drawn appropriately. This type of graph can misrepresent data and lead to Sales for Company

A misleading graph is a statistical graph that is
A misleading graph is a statistical graph that is not drawn appropriately. This type of graph can misrepresent data and lead to Sales for Company false conclusions. 130 O (a) Explain why the graph is misleading. (b) Redraw the graph so that it is not misleading, Sales (in $1000) 3rd 2nd 1st 4th Quarter (a) Choose the correct answer below. O A. The large gap in the vertical axis makes it appear that the sales for the 3rd quarter are disproportionately larger than the other quarters. O B. The area for the 3rd quarter sales is drawn artificially larger than the area for the other quarters. O C. There is a gap between the quarter values. O D. The quarters displayed out of order

Step by Step Solution

There are 3 Steps involved in it

1 Expert Approved Answer
Step: 1 Unlock blur-text-image
Question Has Been Solved by an Expert!

Get step-by-step solutions from verified subject matter experts

Step: 2 Unlock
Step: 3 Unlock

Students Have Also Explored These Related Mathematics Questions!