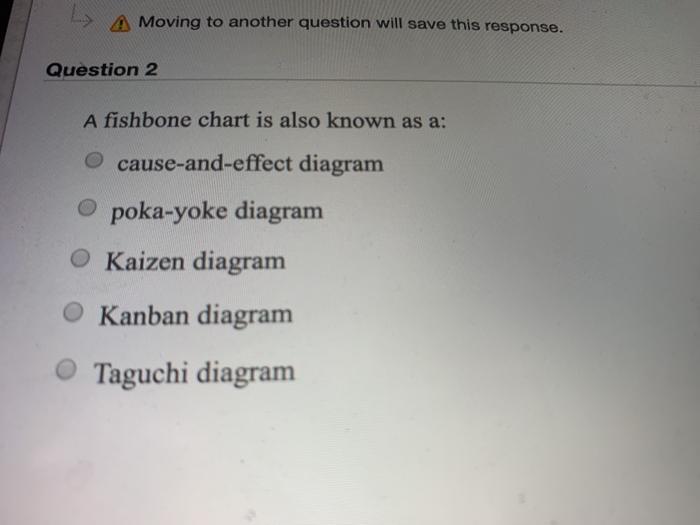
Question: A Moving to another question will save this response. Question 2 A fishbone chart is also known as a: cause-and-effect diagram poka-yoke diagram Kaizen diagram

A Moving to another question will save this
A Moving to another question will save this response. Question 2 A fishbone chart is also known as a: cause-and-effect diagram poka-yoke diagram Kaizen diagram O Kanban diagram Taguchi diagram Question 4 The forecasting technique that pools the opinions of a group of experts or managers is known as: jury of executive opinion. the expert judgment model. multiple regression. market survey management coefficients

Step by Step Solution

There are 3 Steps involved in it

1 Expert Approved Answer
Step: 1 Unlock blur-text-image
Question Has Been Solved by an Expert!

Get step-by-step solutions from verified subject matter experts

Step: 2 Unlock
Step: 3 Unlock

Students Have Also Explored These Related General Management Questions!