

Question: A Moving to another question will save this response. Question 4 A machine fills boxes with cereal. The labeled weight is 9 oz. The quality
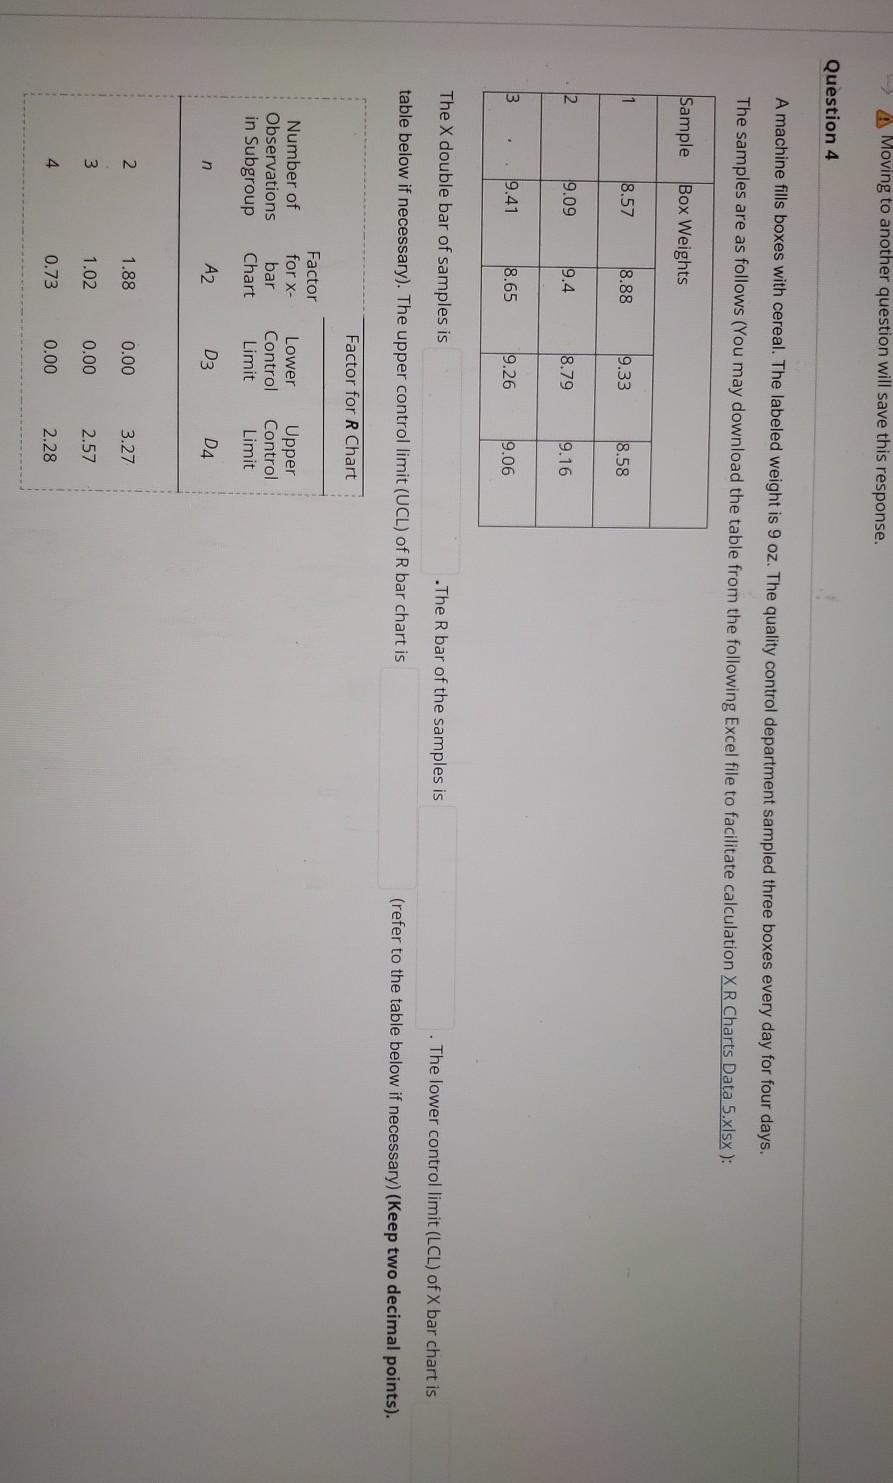
A Moving to another question will save this response. Question 4 A machine fills boxes with cereal. The labeled weight is 9 oz. The quality control department sampled three boxes every day for four days. The samples are as follows (You may download the table from the following Excel file to facilitate calculation X R Charts Data 5.xlsx): Sample Box Weights 1 8.57 8.88 9.33 8.58 2 9.09 9.4 8.79 9.16 3 9.41 8.65 9.26 19.06 The X double bar of samples is .The R bar of the samples is The lower control limit (LCL) of X bar chart is table below if necessary). The upper control limit (UCL) of R bar chart is (refer to the table below if necessary) (Keep two decimal points). Factor for R Chart Factor for X- Number of Observations in Subgroup bar Chart Lower Control Limit Upper Control Limit n A2 D3 D4 1.88 0.00 3.27 W. N 1.02 0.00 2.57 4 0.73 0.00 2.28
Step by Step Solution
There are 3 Steps involved in it
1 Expert Approved Answer
Step: 1 Unlock

Question Has Been Solved by an Expert!
Get step-by-step solutions from verified subject matter experts
Step: 2 Unlock
Step: 3 Unlock