

Question: A multiple regression output is displayed below. In the table, the dependent variable (EXPENDIT) is annual spending on social welfare programs (i.e., in millions of
A multiple regression output is displayed below. In the table, the dependent variable (EXPENDIT) is annual spending on social welfare programs (i.e., in millions of dollars), and the independent variables are 1) the number of business permits issued each year (i.e., BPRMT) and 2) the number of residents in a state (i.e., POP).
Based on the model about the annual spending on social welfare programs, is the following statement true or false?
1. - Population size (POP) is positively associated with the dependent variable controlling for the impact of another independent variable, but the relationship is not significant at a 0.1 significance level.
True
False
2. Regarding the regression result about the annumal spending on social welfare programs in the previous question, is the following statement true or false?
[TRUE/FALSE] Controlling for the impact of another independent variable, the number of business permits issued each year (BORMT) is negatively associated with the dependent variable, which is statistically significant at a 0.01 significance level.
True
False
3. Regarding the regression result about the annumal spending on social welfare programs in the previous question, is the following statement true or false?
[TRUE/FALSE] The variation of the dependent variable is explained by the model about 79.1%.
True
False
4. Regarding the regression result about the annumal spending on social welfare programs in the previous question, is the following statement true or false?
[TRUE/FALSE] Based on the regression result, we can say that the marginal increase of the size of population variable would increase the dependent variable as much as 0.293, controlling the impact of BPRMT.
True
False
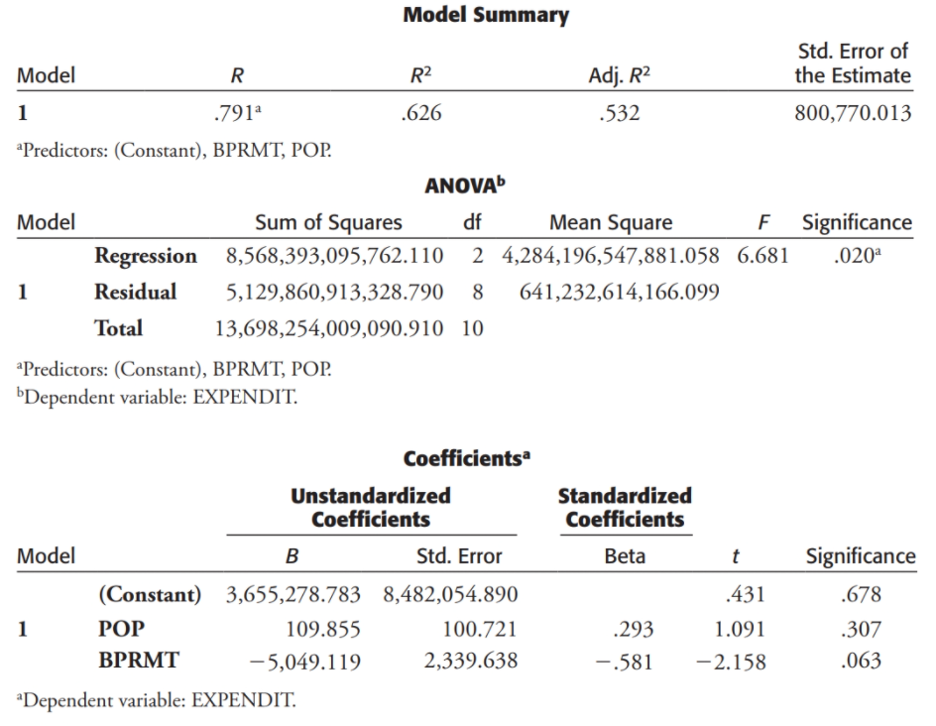
Model Summary Std. Error of Model R R2 Adj. R2 the Estimate 1 7912 .626 532 800,770.013 Predictors: (Constant), BPRMT, POP. ANOVA Model Sum of Squares df Mean Square F Significance Regression 8,568,393,095,762.110 2 4,284,196,547,881.058 6.681 020a Residual 5,129,860,913,328.790 8 641,232,614,166.099 Total 13,698,254,009,090.910 10 Predictors: (Constant), BPRMT, POP. bDependent variable: EXPENDIT. Coefficientsa Unstandardized Standardized Coefficients Coefficients Model B Std. Error Beta t Significance (Constant) 3,655,278.783 8,482,054.890 .431 .678 1 POP 109.855 100.721 293 1.091 307 BPRMT -5,049.119 2,339.638 -.581 -2.158 063 *Dependent variable: EXPENDIT
Step by Step Solution
There are 3 Steps involved in it

Get step-by-step solutions from verified subject matter experts