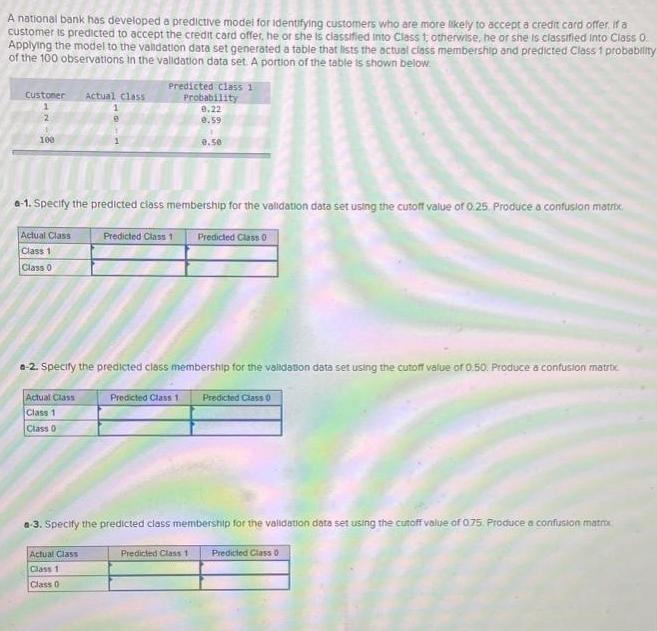
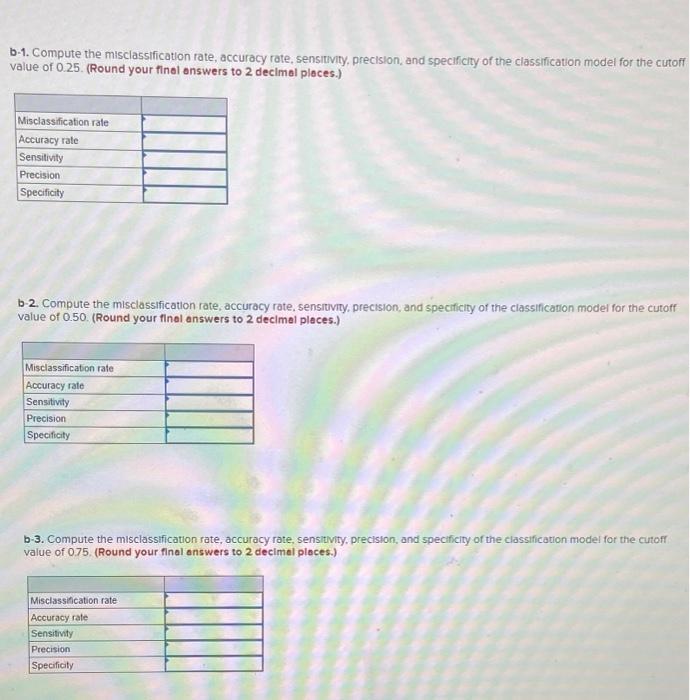
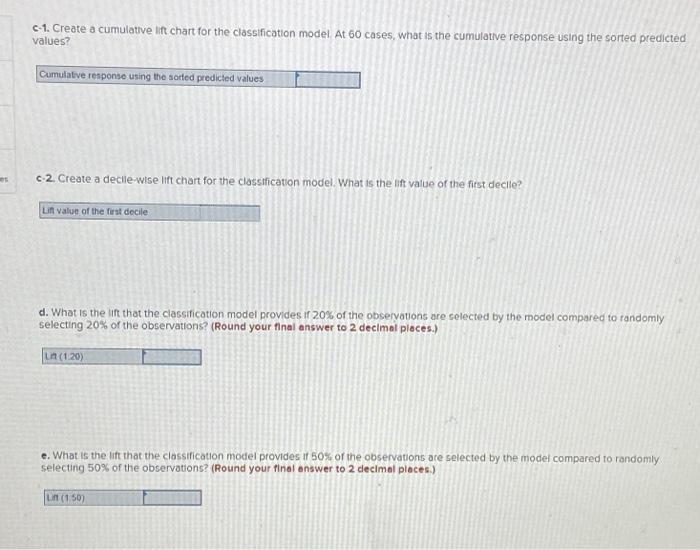
A national bank has developed a predictive model for identifying customers who are more likely to...
Fantastic news! We've Found the answer you've been seeking!
Question:
Transcribed Image Text:
A national bank has developed a predictive model for identifying customers who are more likely to accept a credit card offer, if a customer is predicted to accept the credit card offer, he or she is classified into Classt, otherwise, he or she is classified into Class 0. Applying the model to the validation data set generated a table that lists the actual class membership and predicted Class 1 probability of the 100 observations in the validation data set. A portion of the table is shown below. Predicted Class 1 Probability 0.22 0.59 Customer 2 A 100 Actual Class 0.50 a-1. Specify the predicted class membership for the validation data set using the cutoff value of 0.25. Produce a confusion matrix, Actual Class Class 1 Class 0 Actual Class Class 1 Class 0 Predicted Class 1 Predicted Class 0 a-2. Specify the predicted class membership for the validation data set using the cutoff value of 0.50. Produce a confusion matric Predicted Class 1 Predicted Class 0 Actual Class Class 1 Class 0 LINE a-3. Specify the predicted class membership for the validation data set using the cutoff value of 0.75. Produce a confusion matro Predicted Class 1 Predicted Class 0. b-1. Compute the misclassification rate, accuracy rate, sensitivity, precision, and specificity of the classification model for the cutoff value of 0.25. (Round your final answers to 2 decimal places.) Misclassification rate Accuracy rate Sensitivity Precision Specificity b-2. Compute the misclassification rate, accuracy rate, sensitivity, precision, and specificity of the classification model for the cutoff value of 0.50. (Round your final answers to 2 decimal places.) Misclassification rate Accuracy rate Sensitivity Precision Specificity b-3. Compute the misclassification rate, accuracy rate, sensitivity, precision, and specificity of the classification model for the cutoff value of 0.75. (Round your final answers to 2 decimal places.) Misclassification rate Accuracy rate Sensitivity Precision Specificity es c-1. Create a cumulative lift chart for the classification model At 60 cases, what is the cumulative response using the sorted predicted values? Cumulative response using the sorted predicted values c-2. Create a decile-wise lift chart for the classification model. What is the lift value of the first decile? Lift value of the first decile d. What is the lift that the classification model provides if 20% of the observations are selected by the model compared to randomly selecting 20% of the observations? (Round your final answer to 2 decimal places.) Lin (120) e. What is the lift that the classification model provides if 50% of the observations are selected by the model compared to randomly selecting 50% of the observations? (Round your final answer to 2 decimal places.) Lint (1.50) A national bank has developed a predictive model for identifying customers who are more likely to accept a credit card offer, if a customer is predicted to accept the credit card offer, he or she is classified into Classt, otherwise, he or she is classified into Class 0. Applying the model to the validation data set generated a table that lists the actual class membership and predicted Class 1 probability of the 100 observations in the validation data set. A portion of the table is shown below. Predicted Class 1 Probability 0.22 0.59 Customer 2 A 100 Actual Class 0.50 a-1. Specify the predicted class membership for the validation data set using the cutoff value of 0.25. Produce a confusion matrix, Actual Class Class 1 Class 0 Actual Class Class 1 Class 0 Predicted Class 1 Predicted Class 0 a-2. Specify the predicted class membership for the validation data set using the cutoff value of 0.50. Produce a confusion matric Predicted Class 1 Predicted Class 0 Actual Class Class 1 Class 0 LINE a-3. Specify the predicted class membership for the validation data set using the cutoff value of 0.75. Produce a confusion matro Predicted Class 1 Predicted Class 0. b-1. Compute the misclassification rate, accuracy rate, sensitivity, precision, and specificity of the classification model for the cutoff value of 0.25. (Round your final answers to 2 decimal places.) Misclassification rate Accuracy rate Sensitivity Precision Specificity b-2. Compute the misclassification rate, accuracy rate, sensitivity, precision, and specificity of the classification model for the cutoff value of 0.50. (Round your final answers to 2 decimal places.) Misclassification rate Accuracy rate Sensitivity Precision Specificity b-3. Compute the misclassification rate, accuracy rate, sensitivity, precision, and specificity of the classification model for the cutoff value of 0.75. (Round your final answers to 2 decimal places.) Misclassification rate Accuracy rate Sensitivity Precision Specificity es c-1. Create a cumulative lift chart for the classification model At 60 cases, what is the cumulative response using the sorted predicted values? Cumulative response using the sorted predicted values c-2. Create a decile-wise lift chart for the classification model. What is the lift value of the first decile? Lift value of the first decile d. What is the lift that the classification model provides if 20% of the observations are selected by the model compared to randomly selecting 20% of the observations? (Round your final answer to 2 decimal places.) Lin (120) e. What is the lift that the classification model provides if 50% of the observations are selected by the model compared to randomly selecting 50% of the observations? (Round your final answer to 2 decimal places.) Lint (1.50)
Expert Answer:
Answer rating: 100% (QA)
A 1 Validation data set Customer Actual Class Predicted class 1 probability 1 1 022 2 1 100 Cutoff v... View the full answer
Related Book For
Statistics for the Behavioral Sciences
ISBN: 978-1111830991
9th edition
Authors: Frederick J Gravetter, Larry B. Wallnau
Posted Date:
Students also viewed these accounting questions
-
Research has shown that people are more likely to show dishonest and self-interested behaviors in darkness than in a well-lit environment (Zhong, Bohns, & Gino, 2010). In one experiment, participants...
-
Research has shown that people are more likely to show dishonest and self-interested behaviors in darkness than in a well-lit environment (Zhong, Bohns, & Gino, 2010). In one experiment, participants...
-
Research has shown that people are more likely to show dishonest and self-interested behaviors in darkness than in a well-lit environment (Zhong, Bohns, & Gino, 2010). In a related experiment,...
-
Determine the order of growth of the running time of this statement in ThreeSum as a function of the number of integers \(n\) on standard input: int[] a = StdIn. readA11Ints(); Answer: Linear. The...
-
Can a bank simultaneously maximize return and minimize credit risk? If not, what can it do instead?
-
In Exercises draw the graph and determine the domain and range of the function. y = - 3 log (x + 2) + 1
-
(e) Produce a figure similar to Figure 1.4, but with the line of best fit from the mixed model instead of the simple regression line. Add the shrunk means to this plot. Comment on their distribution...
-
During January, its first month of operations, Knox Tool & Die accumulated the following manufacturing costs: raw materials $4,000 on account, factory labor $6,000 of which $5,200 relates to factory...
-
You are the auditor of Sanitization, Inc., a small public company. Sanitization manufactures and distributes hand sanitizer and cleaning products through a network of independent distributors. You...
-
Your city recently won the bid to host its first NCAA Final Four men's basketball championship. Part of the costs of hosting the event were paid from a tax fund created to attract major events. A...
-
1. Provide a summary (in your own words) of the takeover process, include details of parties, documents and timeframes. (min 500 words) 2. Provide details of what insider trading is. Why is it...
-
How has face book influenced political candidate's electoral success? What is the relationship between social media technology called face book and electoral success?
-
1. Discuss the international strategies that organizations can pursue 2. Identify and compare the various modes of of foreign market entry 3. Analyse the industry market 4. Evaluate relevant macro...
-
A bulk carrier was underway. The vessel was in ballast and hold washing was scheduled in preparation for taking the next cargo. An officer, bosun, and another deck crew conducted a risk assessment...
-
8. Neutrino radiation was observed over a certain period and the number of hours in which 0, 1, 2,... signals were received was recorded. 0 1 Number of Number of Hours with Signals per Hour This...
-
What are some advantages and disadvantages of centralization and decentralization. References: Altamimi, H., Liu, Q., & Jimenez, B. (2023). Not Too Much, Not Too Little: Centralization,...
-
Question 2 [25 points) Vision Consulting Inc. was authorized to issue 400,000 $2.00 preferred shares and 600,000 common shares. During September 2014, their first month of operations, the following...
-
What mass of KBr (in grams) should you use to make 350.0 mL of a 1.30 M KBr solution?
-
A psychologist is investigating the hypothesis that children who grow up as the only child in the household develop different personality characteristics than those who grow up in larger families. A...
-
Do you view a chocolate bar as delicious or as fattening? Your attitude may depend on your gender. In a study of American college students, Rozin, Bauer, and Catanese (2003) examined the importance...
-
a. A repeated-measures study with a sample of n = 9 participants produces a mean difference of MD = 3 with a standard deviation of s = 6. Based on the mean and standard deviation, you should be able...
-
Irrelevant facial similarity effects on judgment. Facial similarity to previously encountered persons can be a potential source of bias in decision making. For example, in a job interview, the...
-
Following is a partially completed ANOVA table for a 3 * 4 factorial experiment with two replications: Source df SS MS F A .8 B 5.3 AB 9.6 Error Total 18.1 a. Complete the ANOVA table. b. Which sums...
-
Effect of massage on boxers. Eight amateur boxers participated in an experiment to investigate the effect of massage on boxing performance (British Journal of Sports Medicine, Apr. 2000). The...
Study smarter with the SolutionInn App