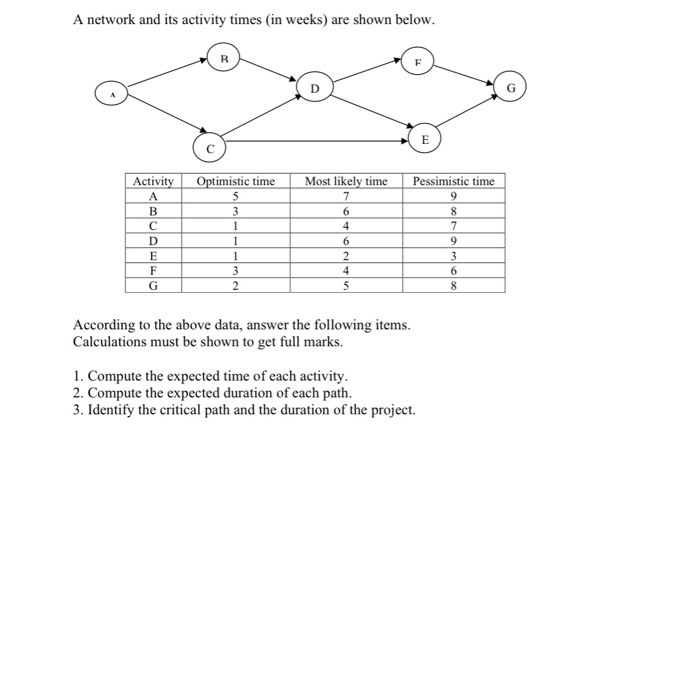
Question: A network and its activity times in weeks) are shown below. a Activity Optimistic time Most likely time Pessimistic time . 6 E F G

A network and its activity times in weeks) are
A network and its activity times in weeks) are shown below. a Activity Optimistic time Most likely time Pessimistic time . 6 E F G S. According to the above data, answer the following items Calculations must be shown to get full marks. 1. Compute the expected time of each activity. 2. Compute the expected duration of each path. 3. Identify the critical path and the duration of the project

Step by Step Solution

There are 3 Steps involved in it

1 Expert Approved Answer
Step: 1 Unlock blur-text-image
Question Has Been Solved by an Expert!

Get step-by-step solutions from verified subject matter experts

Step: 2 Unlock
Step: 3 Unlock

Students Have Also Explored These Related General Management Questions!