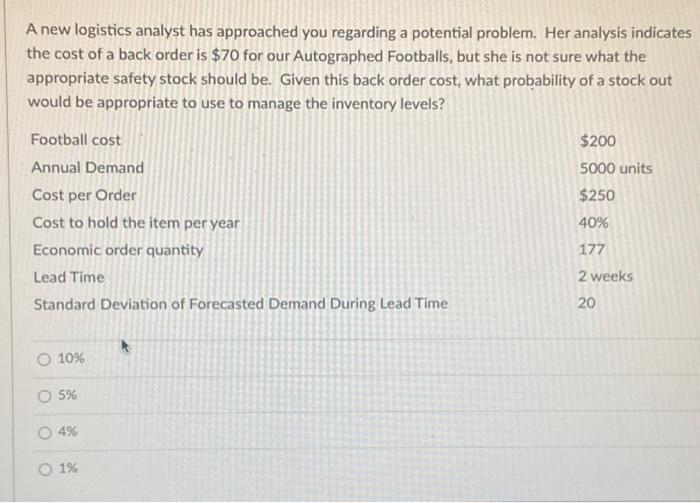
Question: A new logistics analyst has approached you regarding a potential problem. Her analysis indicates the cost of a back order is $70 for our Autographed

A new logistics analyst has approached you
A new logistics analyst has approached you regarding a potential problem. Her analysis indicates the cost of a back order is $70 for our Autographed Footballs, but she is not sure what the appropriate safety stock should be. Given this back order cost, what probability of a stock out would be appropriate to use to manage the inventory levels? $200 5000 units $250 Football cost Annual Demand Cost per Order Cost to hold the item per year Economic order quantity Lead Time Standard Deviation of Forecasted Demand During Lead Time 40% 177 2 weeks 20 10% O 5% 4% 1% Given the probability of a stock out you found in the previous problem, what service level woul be appropriate to use to manage the inventory levels? Remember, a new logistics analyst indicates the cost of a back order is $70 for our Autographed Footballs. Other key data is below Football cost $200 Annual Demand 5000 units Cost per Order $250 Cost to hold the item per year 40% Economic order quantity 177 Lead Time 2 weeks Standard Deviation of Forecasted Demand During Lead Time 20 K to Service Level Conversion + 0.00 0.01 0.03 0.04 0.02 0.5080 0.05 0.07 0.0 0.08 0.5040 0.5000 0.5398 0.09 0.5160 0.5199 0.06 0.5239 0.5636 0.5279 0.1 0.5438 0.5319 0.5478 0.5359 0.5557 0.5596 0.5675 0.2 0.5120 0.5517 0.5910 0.6293 0.5793 0.5714 0.5832 0.6217 0.5948 0.3 0.5871 0.6255 0.6179 0.5987 0.6368 0.6026 0.6406 0.6331 0.6064 0.6443 0.5753 0.6141 0.6517 0.6103 0.6480 0.4 0.6554 0.6628 0.6591 0.6950 0.6664 0.6700 0.6736 0.6772 0.6915 0.5 0.6844 0.6879 0.7019 0.7054 0.7088 0.6 0.6808 0.7157 0.7486 0.7257 0.7224 0.6985 0.7324 0.7642 0.7291 0.7611 0.7357 0.7389 0.7123 0.7454 0.7764 0.7190 0.7517 0.7823 0.7422 0.7734 0.7 0.7580 0.7881 0.7549 0.7673 0.7704 0.7794 0.8 0.7852 0.7910 0.7939 0.7967 0.8023 0.9 0.8186 0.7995 0.8264 0.8133 0.8212 0.8159 0.8413 0.8238 0.8051 0.8315 0.8289 0.8078 0.8340 0.8106 0.8365 1.0 0.8389 0.8438 0.8461 0.8485 0.8508 0.8531 0.8554 0.8643 0.8665 CEASURES &98 0.8686 0.8708 0.8729 0.8749 0.8599 0.8810 0.8521 0.8830 1.2 0.5869 0.8849 0.9032 0.8888 0.9066 0.8925 0.8770 0.8962 0.8907 0.9082 0.8944 0.9115 0.8997 0.9015 0.9049 0.9207 0.8577 0.8790 0.8980 0.9147 0.9292 0.9418 0.9222 0.9099 0.9251 0.9382 0.9192 0.9332 0.9452 0.9236 0.9370 1.5 0.9177 0.9319 0.9152 0.9306 0.9429 0.9345 0.9131 0.9278 0.9406 0.9515 0.9265 0.9394 0.9505 0.9357 0.9441 1.6 0.9463 0.9474 0.9573 0.9484 0.9582 0.9495 0.9591 0.9545 0.9554 0.9554 0.9525 0.9616 0.9599 0.9535 0.9625 0.9608 0.9633 Given the service level you found in the previous problem, what K value would be appropriate to use to manage the inventory levels? Remember, a new logistics analyst indicates the cost of a back order is $70 for our Autographed Footballs. Other key data is below: Football cost $200 Annual Demand 5000 units Cost per Order $250 Cost to hold the item per year 40% Economic order quantity 177 Lead Time 2 weeks Standard Defriation of Forecasted Demand During Lead Time 20 K to Service Level Conversion 0.06 k k 0.00 0.01 0.02 0.03 0.04 0.07 0.08 0.09 0.0 0.5040 0.5080 0.5000 0.5398 0.5160 0.05 0.5199 0.5596 0.5239 0.5279 0.5319 0.1 0.5438 0.5120 0.5517 0.5910 0.5478 0.5557 0.5636 0.5359 0.5753 0.5675 0.2 0.5793 0.5832 0.5871 0.5987 0.6026 0.3 0.5714 0.6103 0.6480 0.6179 0.5948 0.6331 0.6217 0.6255 0.6064 0.6443 0.6293 0.6406 0.6141 0.6517 0.4 0,6591 0.6626 0.6368 0.6736 0.6554 0.6915 0.6772 0.5 0.6664 0.7019 0.6700 0.7054 0.6950 0.6985 0.6808 0.7157 0.6844 0.7190 0.7088 0.7123 0.7291 0.7324 0.6 0.7 0.7357 0.7257 0.7580 0.7389 0.7422 0.7454 0.6879 0.7224 0.7549 0.7852 0.7486 0.7517 0.7611 0.7642 0.7673 0.7704 0.7734 0.7764 0.7794 0.7823 0.8 0.7881 0.7910 0.7939 0.792 A 7000 ht Pulling this together...using the same data as the last few problems....A new logistics analyst has approached you regarding a potential problem. Her analysis indicates the cost of a back order is $70 for our Autographed Footballs, but she is not sure what the appropriate safety stock should be. Given this back order cost, what would you suggest as the appropriate level of safety stock? Football cost $200 Annual Demand 5000 units Cost per Order $250 Cost to hold the item per year 40% Economic order quantity Lead Time 2 weeks Standard Deviation of Forecasted Demand During Lead Time 177 20 K to Service Level Conversion * x 0.00 0.01 0.02 0.03 0.04 0.0 0.05 0.06 0.07 0.08 0.09 0.5080 0.5120 0.5199 0.5239 0.1 0.5160 0.5557 0.5279 0.5319 0.5359 0.5517 0.5596 0.5675 0.2 0.5714 0.5753 0.5000 0.5040 0.5391 0.5438 0.5793 0.5832 0.6179 0.6217 0.6554 0.6591 0.6915 0.6950 0.5910 0.5948 0.3 0.6064 0.5987 0.6368 0.6103 0.6141 0.6293 0.6443 0.5636 0.6026 0.6406 0.6772 0.7123 0.4 0.6480 0.5478 0.5871 0.6255 0.6628 0.6985 0.7324 0.7642 0.6517 0.6331 0.6700 0.7054 0.6664 0.6736 0.5808 0.5 0.5844 0.6879 0.7019 0.7088 0.7157 0.7190 0.6 0.7224 0.7257 0.7580 0.7291 0.7611 0.7389 0.7422 0.7357 0.7673 0.7454 0.7486 0.7 0.7517 0.7704 0.7734 0.7764 0.7794 0.7549 0.7852 0.8 0.7881 0.7823 0.7939 0.7910 0.8186 0.7967 0.7995 0.8051 0.8078 0.9 0_3105 0.8159 0.8023 0.8289 0.8133 0.8212 0.8238 0.8254 0.8315 0.8340 1.0 0.8413 0.8365 0.8389 0.8485 0.8438 0.8665 0.8508 0.8531 0.8461 0.8686 0.8554 0.8643 1.1 0.8599 0.8708 0.8729 0.8577 0.8790 0.8749 0.8770 0.8621 0.8830 0.8810 1.2 0.8888 0.8907 0.8869 0.9049 0.8944 0.8962 0.8925 0.9099 0.8980 0.8849 0.9032 0.9192 1.3 0.8997 0.9015 0.9066 0.9082 0.9115 0.9131 0.9147 0.9162 0.9177 1.4 0.9297 09222 9216

Step by Step Solution

There are 3 Steps involved in it

1 Expert Approved Answer
Step: 1 Unlock blur-text-image
Question Has Been Solved by an Expert!

Get step-by-step solutions from verified subject matter experts

Step: 2 Unlock
Step: 3 Unlock

Students Have Also Explored These Related General Management Questions!