A new manager of a McDonalds outlet in Singapore observes that on a typical day, there will
Question:
He sees a lot of people inside the outlet, either standing around or sitting at empty tables waiting for their orders. He also hears the customer queue numbers being called when the orders are ready.
He notices that some of the customers are served when the orders are ready whilst others will self-collect the orders at the counter either for dine-in, take-away or delivery.
Most of the customers seem to be making payments online at the self-ordering kiosks whilst a small group of people appear to be still paying by cash at a special counter at the corner.
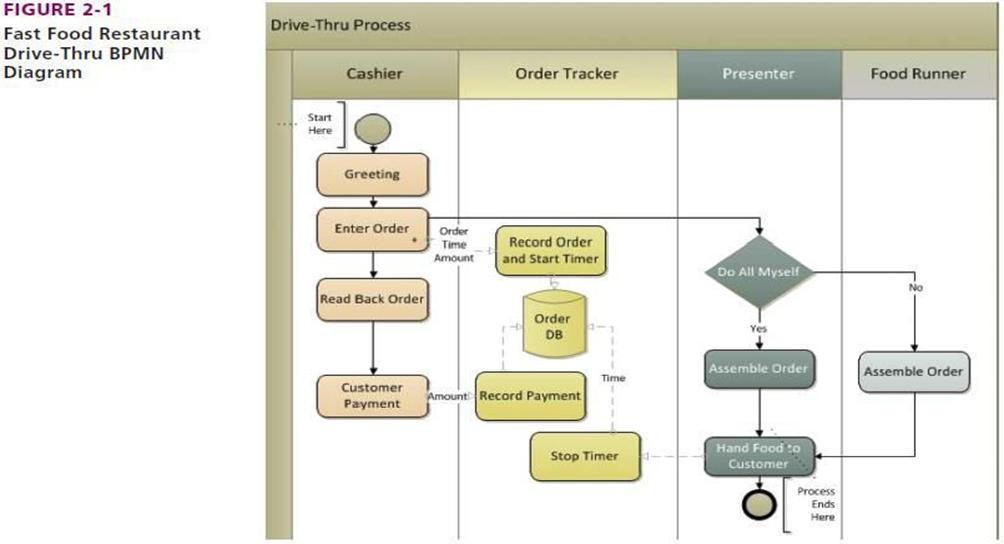
To know exactly what is happening, the new manager has engaged you to draw a BPMN to show the sequence and relationship of events that he has been observing at the outlet.
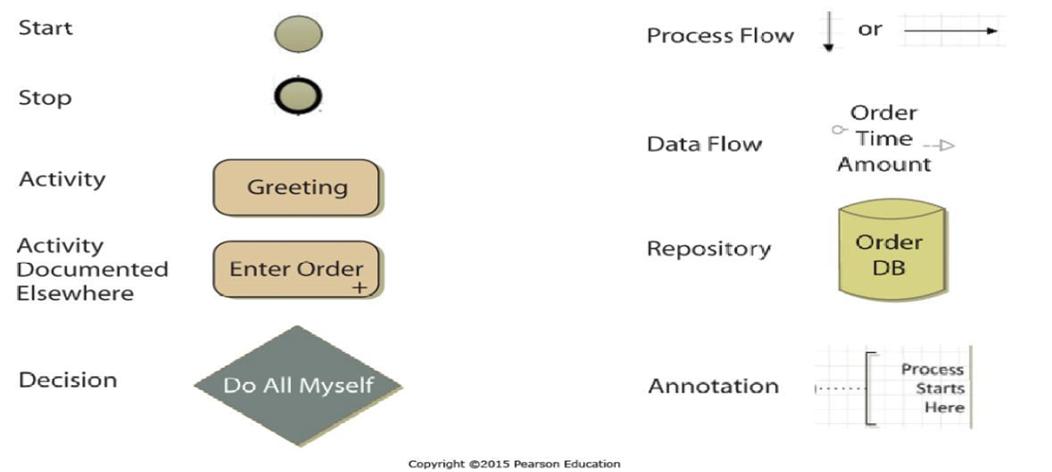
To create a BPMN diagram for software, it's essential to utilize the appropriate tools such as:
- Microsoft Visio
- www.draw.io
- Lucidchart
For examples:
Question 2a
Relevant swim lanes
Question 2b
Appropriate processes
Question 2c
Timely decision points
Question 2d
Logical process and data flows
Question 2e
Overall tidiness of diagram
Expert Answer:
To create a BPMN Business Process Model and Notation diagram for the situation at the McDonalds outlet in Singapore as described we need to identify t... View the full answer