

Question: A. No. 1. The chart shown below plots the net present value (NPV) of projects A and B at different discount rates. Both projects are
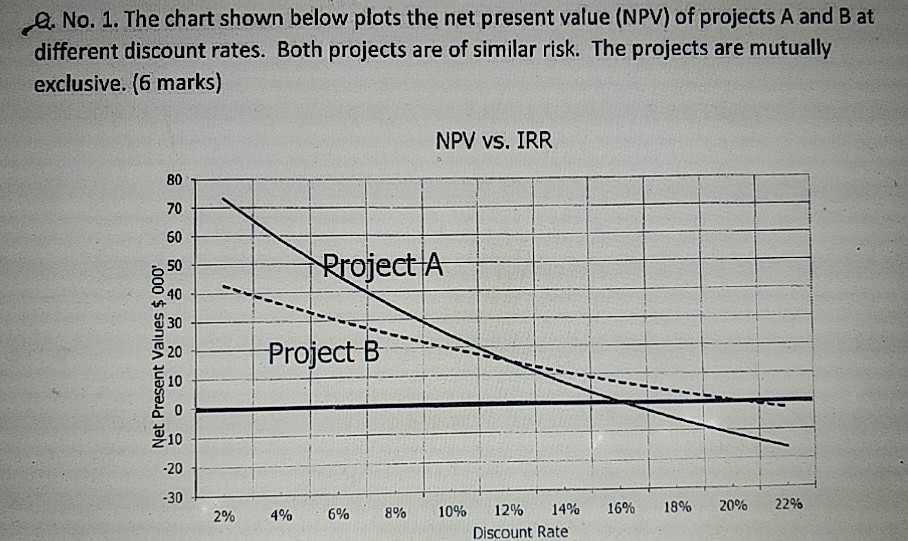
A. No. 1. The chart shown below plots the net present value (NPV) of projects A and B at different discount rates. Both projects are of similar risk. The projects are mutually exclusive. (6 marks) NPV vs. IRR 80 70 60 50 Project A 40 30 Net Present Values $ 000 20 Project B 10 -20 -30 2% 18% 4% 10% 8% 20% 22% 6% 16% 12% 14% Discount Rate a. What is the significance of the point on the graph where the two lines intersect? b. What is the significance of the points on the graph where the two lines cross the zero- NPV axis? c. What is the likely explanation for the differences in NPV at the various discount rates
Step by Step Solution
There are 3 Steps involved in it
1 Expert Approved Answer
Step: 1 Unlock

Question Has Been Solved by an Expert!
Get step-by-step solutions from verified subject matter experts
Step: 2 Unlock
Step: 3 Unlock