

Question: A number of scattergraphs displaying cost behaviour patterns are shown below. The vertical axis on each graph represents total cost, and the horizontal axis represents
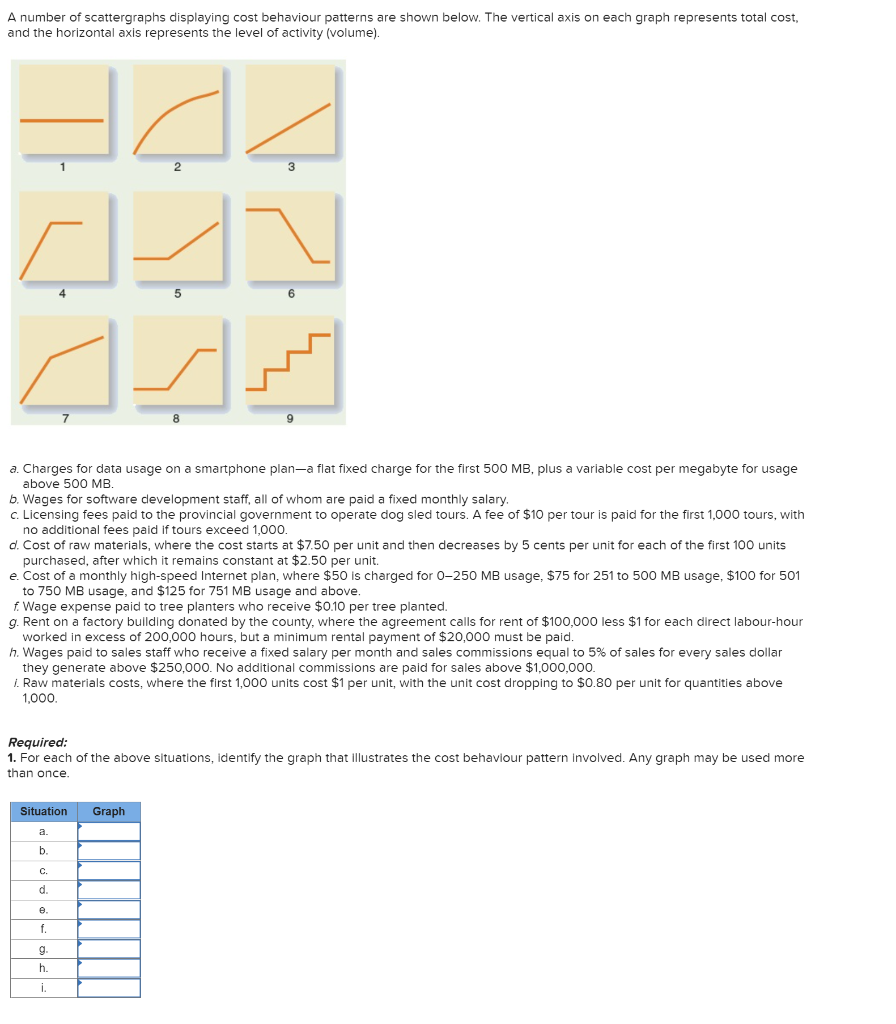
A number of scattergraphs displaying cost behaviour patterns are shown below. The vertical axis on each graph represents total cost, and the horizontal axis represents the level of activity (volume). 2 3 d4 JI 5 a. Charges for data usage on a smartphone plan-a flat fixed charge for the first 500 MB, plus a variable cost per megabyte for usage above 500 MB. 6. Wages for software development staff, all of whom are paid a fixed monthly salary. c. Licensing fees paid to the provincial government to operate dog sled tours. A fee of $10 per tour is paid for the first 1,000 tours, with no additional fees paid if tours exceed 1,000. d. Cost of raw materials, where the cost starts at $7.50 per unit and then decreases by 5 cents per unit for each of the first 100 units purchased, after which it remains constant at $2.50 per unit. e Cost of a monthly high-speed Internet plan, where $50 is charged for 0-250 MB usage, $75 for 251 to 500 MB usage, $100 for 501 to 750 MB usage, and $125 for 751 MB usage and above. f. Wage expense paid to tree planters who receive $0.10 per tree planted. g. Rent on a factory building donated by the county, where the agreement calls for rent of $100,000 less $1 for each direct labour-hour worked in excess of 200,000 hours, but a minimum rental payment of $20,000 must be paid. h. Wages paid to sales staff who receive a fixed salary per month and sales commissions equal to 5% of sales for every sales dollar they generate above $250,000. No additional commissions are paid for sales above $1,000,000. 1. Raw materials costs, where the first 1,000 units cost $1 per unit, with the unit cost dropping to $0.80 per unit for quantities above 1,000 Required: 1. For each of the above situations, identify the graph that illustrates the cost behaviour pattern involved. Any graph may be used more than once. Situation Graph b C. d. e f. g h
Step by Step Solution
There are 3 Steps involved in it

Get step-by-step solutions from verified subject matter experts