

Question: A Numerical Example: Flu Vaccines PRICE $ 0 , $ 1 5 , $ 2 0 , $ 2 5 , $ 3 0 Quantity
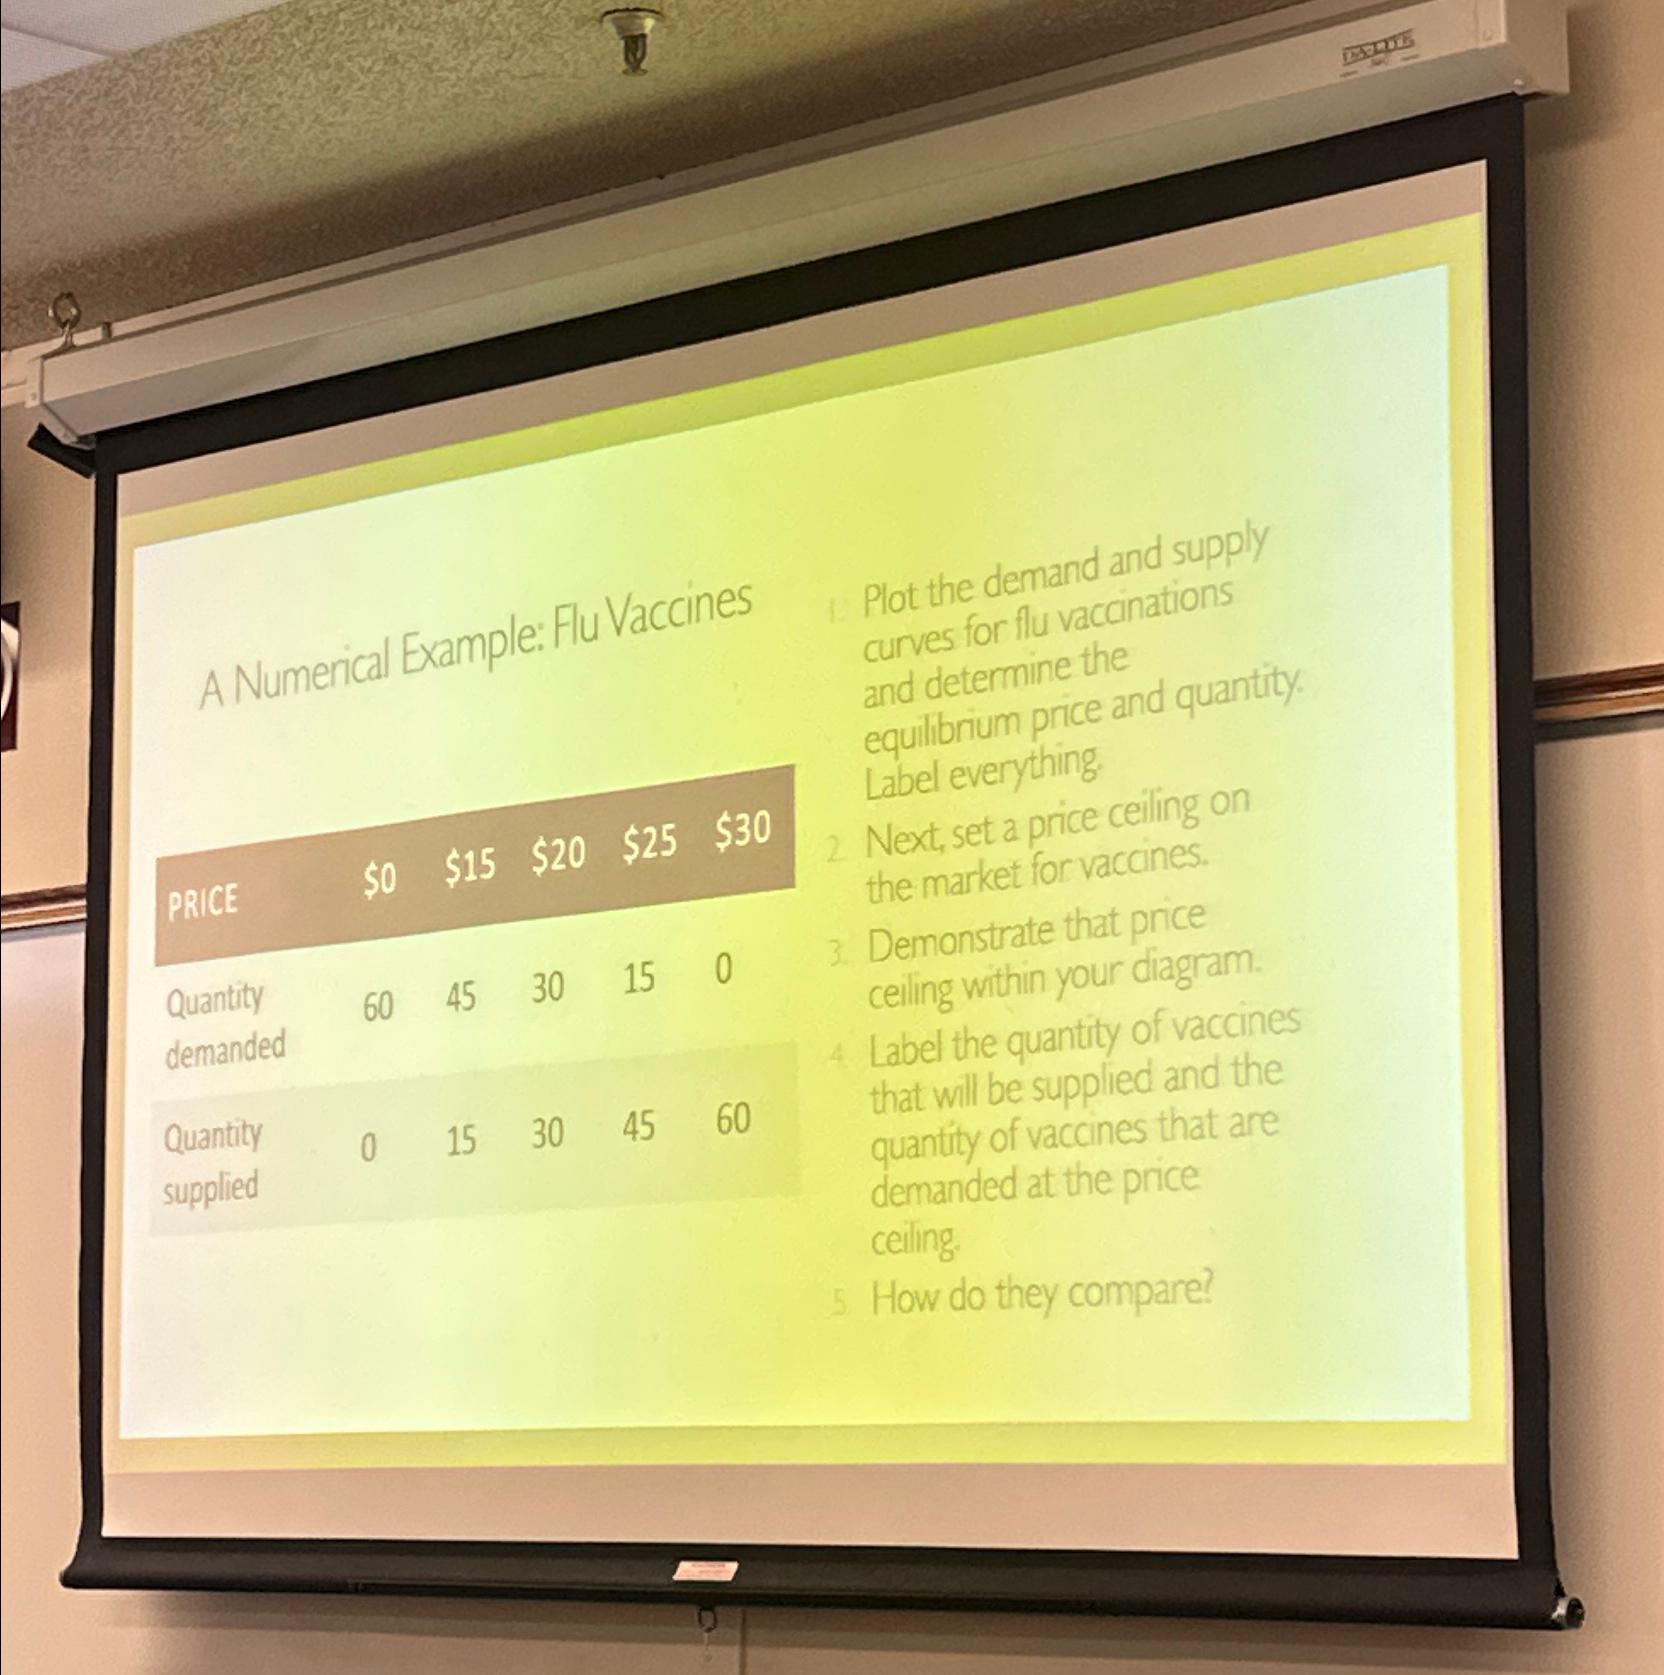
A Numerical Example: Flu Vaccines
PRICE $$$$$
Quantity
demanded
Quantity supplied
Plot the demand and supply curves for flu vaccinations and determine the equilibrium price and quantity. Label everything:
Next, set a price ceiling on the market for vaccines.
Demonstrate that price ceiling within your diagram.
Label the quantity of vaccines that will be supplied and the quantity of vaccines that are demanded at the price ceiling.
How do they compare?
Step by Step Solution
There are 3 Steps involved in it
1 Expert Approved Answer
Step: 1 Unlock

Question Has Been Solved by an Expert!
Get step-by-step solutions from verified subject matter experts
Step: 2 Unlock
Step: 3 Unlock