

Question: A. On the right-hand side construct a stem and leaf plot for the following data: 64 98 96 93 70 97 74 67 63 71
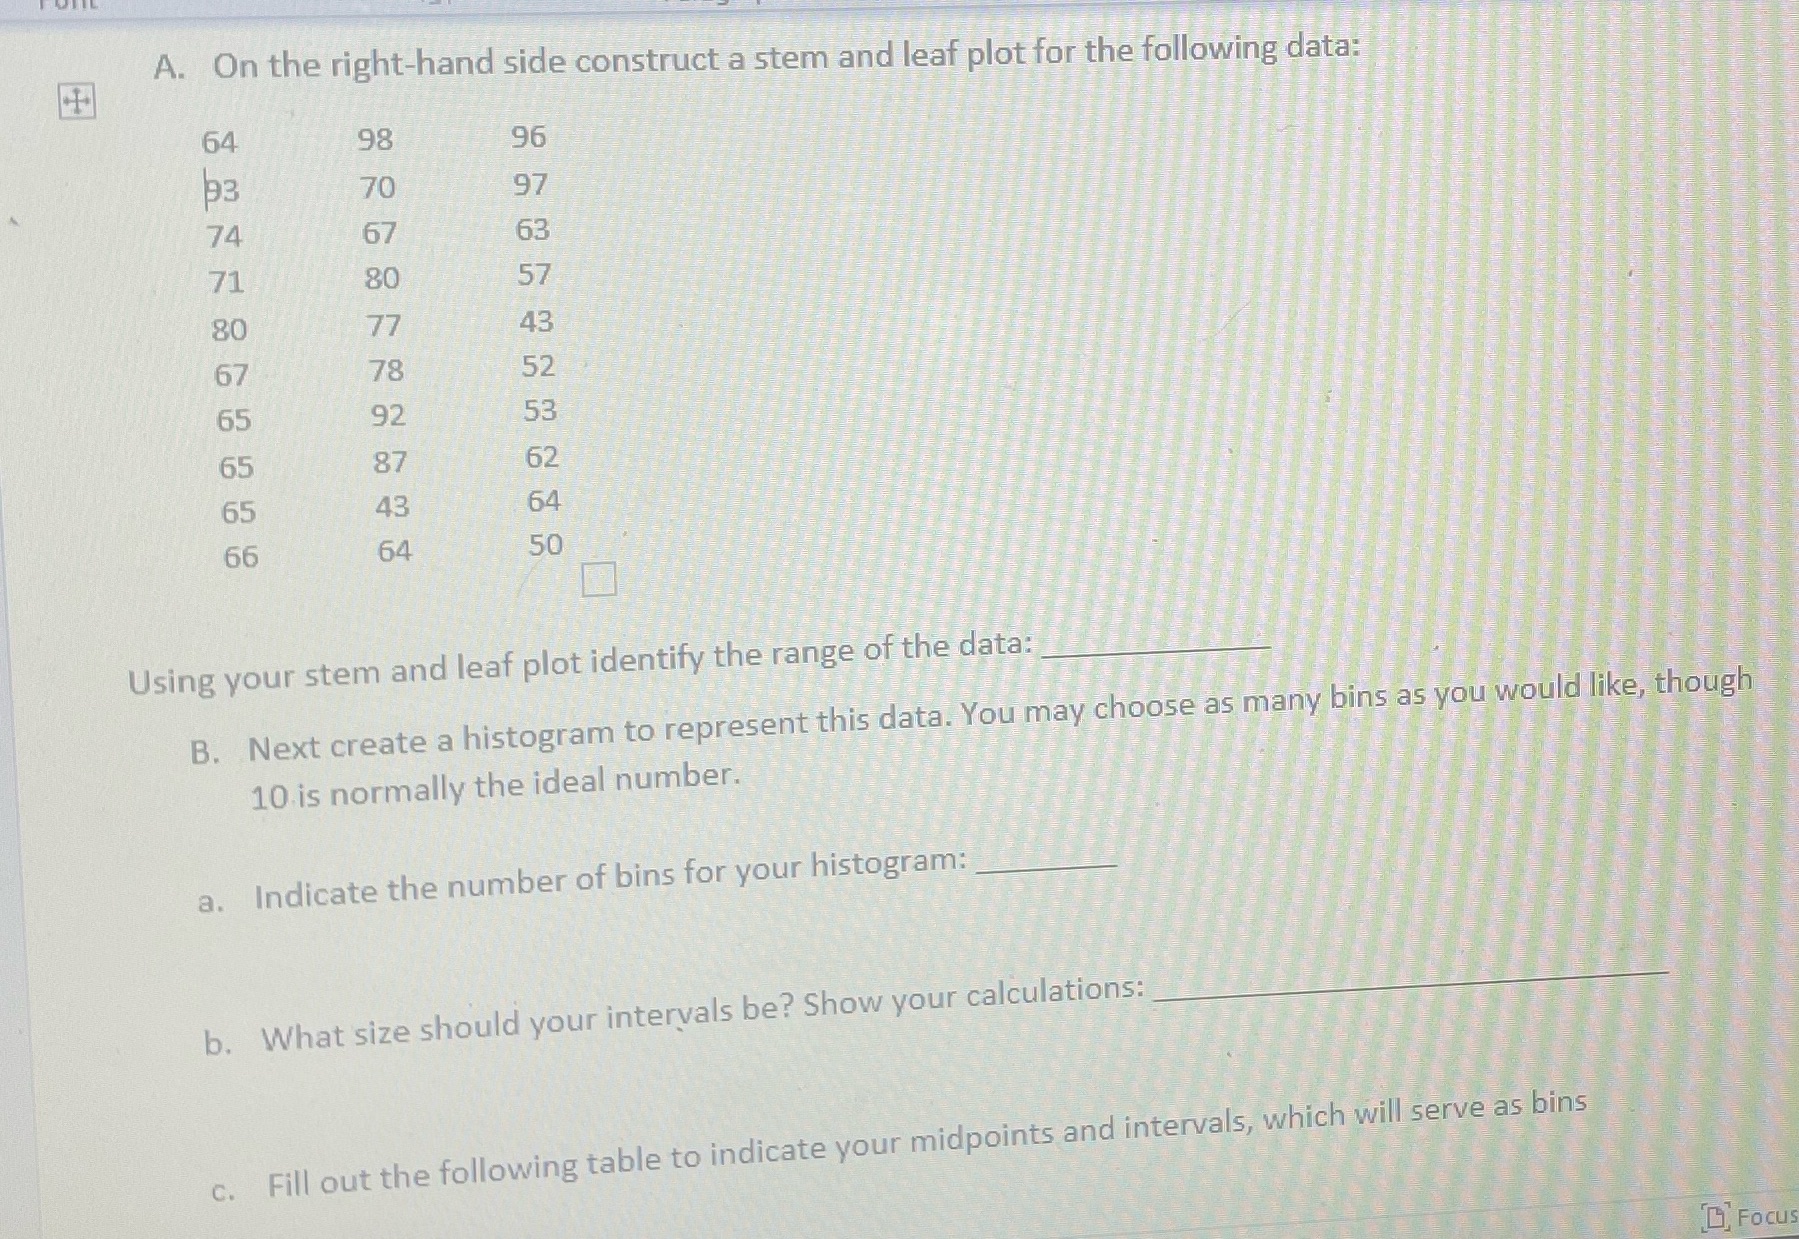
A. On the right-hand side construct a stem and leaf plot for the following data: 64 98 96 93 70 97 74 67 63 71 80 57 80 77 43 67 78 52 65 92 53 65 87 65 43 64 66 64 50 Using your stem and leaf plot identify the range of the data: B. Next create a histogram to represent this data. You may choose as many bins as you would like, though 10 is normally the ideal number. a. Indicate the number of bins for your histogram: b. What size should your intervals be? Show your calculations: c. Fill out the following table to indicate your midpoints and intervals, which will serve as bins Focus
Step by Step Solution
There are 3 Steps involved in it
1 Expert Approved Answer
Step: 1 Unlock

Question Has Been Solved by an Expert!
Get step-by-step solutions from verified subject matter experts
Step: 2 Unlock
Step: 3 Unlock