

Question: A one-way repeated measures ANOVA was conducted to evaluate the null hypothesis that there is no effect in implementing self-efficacy training in improving of the
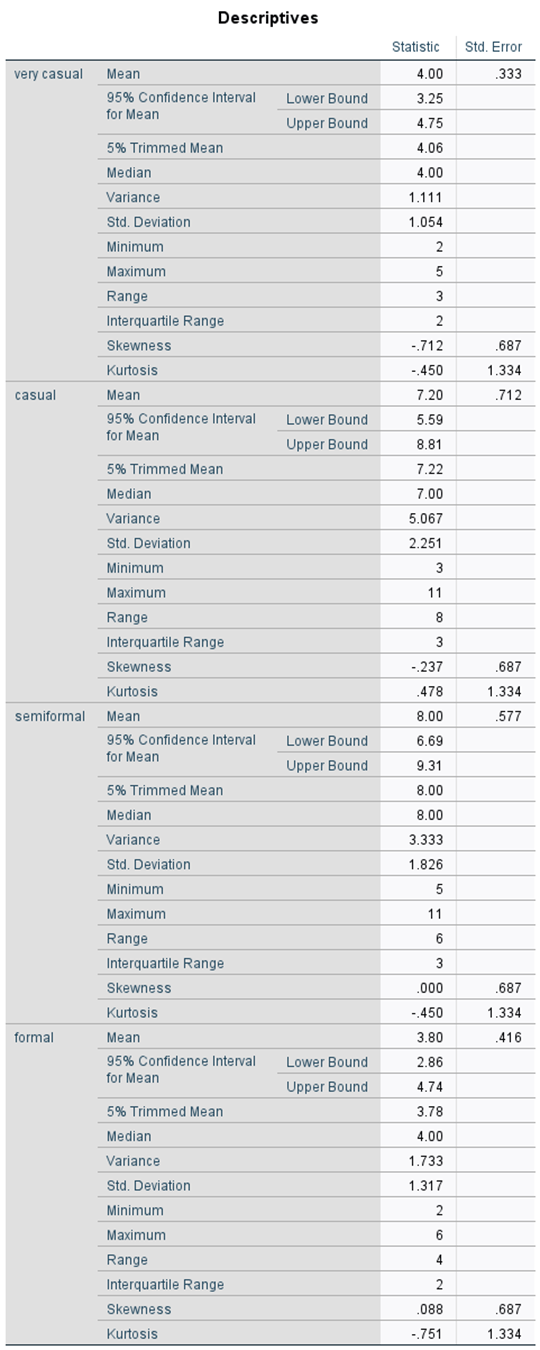
A one-way repeated measures ANOVA was conducted to evaluate the null hypothesis that there is no effect in implementing self-efficacy training in improving of the field performances. In measurement of players errors in a game taken in 4 different programs in a group of twelve players (N=12).The means and standard deviations of the sample at each condition were: (1) Very Casual (M = 4.0, SD = 1.054), 2) Casual (M = 7.20, SD = 2.251), 3) Semiformal (M = 8.00, SD = 1.826), 4) Formal (M = 3.80, SD = 1.317). See Table 1.
The result of the ANOVA indicated a significant effect of self-efficacy in improving field performance, Wilks Lambda = .088, F (3, 10) = 24.133, P
Follow-up comparison indicated that each pairwise comparison difference was significant p<.05. there was significant improvement in performance overtime with increase self-efficacy.>
Please submit the tables below in narrative form.
Step by Step Solution
There are 3 Steps involved in it

Get step-by-step solutions from verified subject matter experts