

Question: A packaging process is supposed to till small boxes ot raisins with approximately 5 0 raisins so that each box will have the same mass.
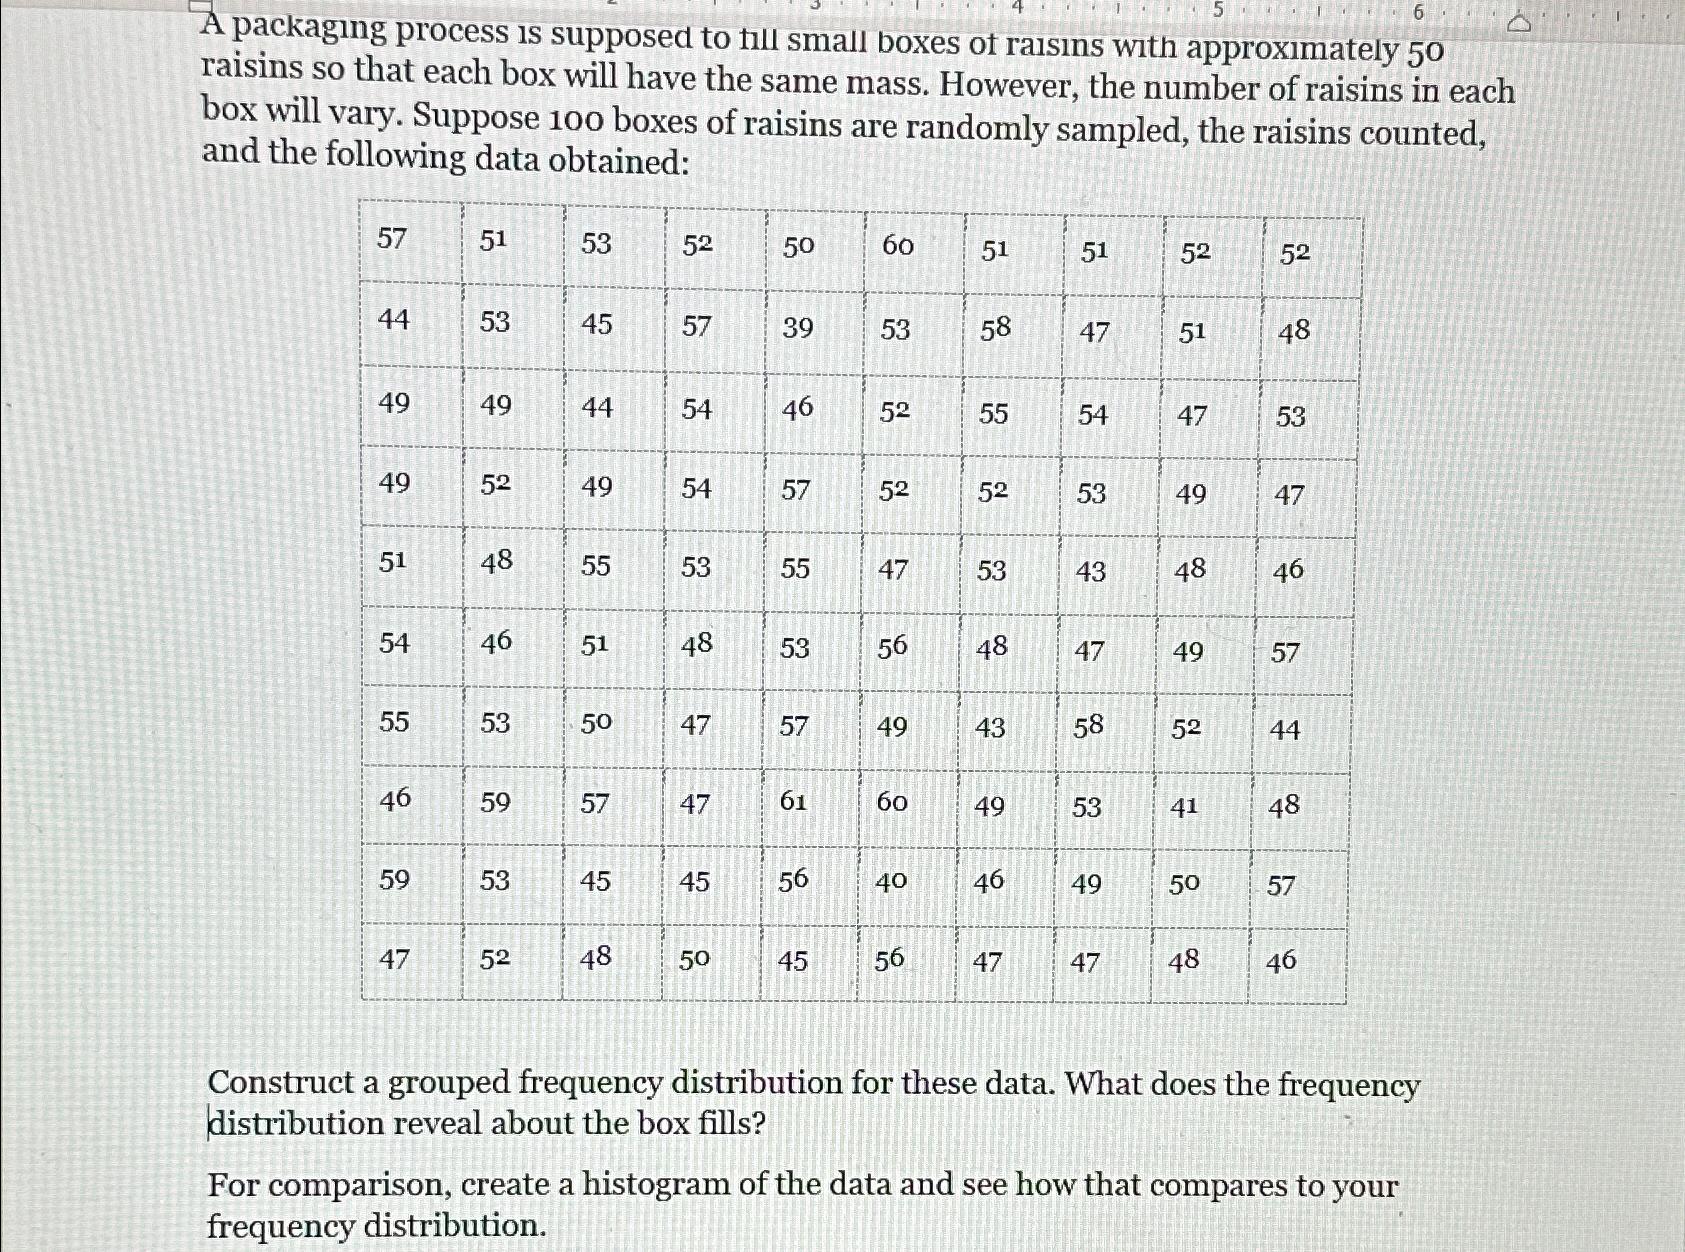
A packaging process is supposed to till small boxes ot raisins with approximately raisins so that each box will have the same mass. However, the number of raisins in each box will vary. Suppose boxes of raisins are randomly sampled, the raisins counted, and the following data obtained:
table
Construct a grouped frequency distribution for these data. What does the frequency distribution reveal about the box fills?
For comparison, create a histogram of the data and see how that compares to your frequency distribution.
Step by Step Solution
There are 3 Steps involved in it
1 Expert Approved Answer
Step: 1 Unlock

Question Has Been Solved by an Expert!
Get step-by-step solutions from verified subject matter experts
Step: 2 Unlock
Step: 3 Unlock