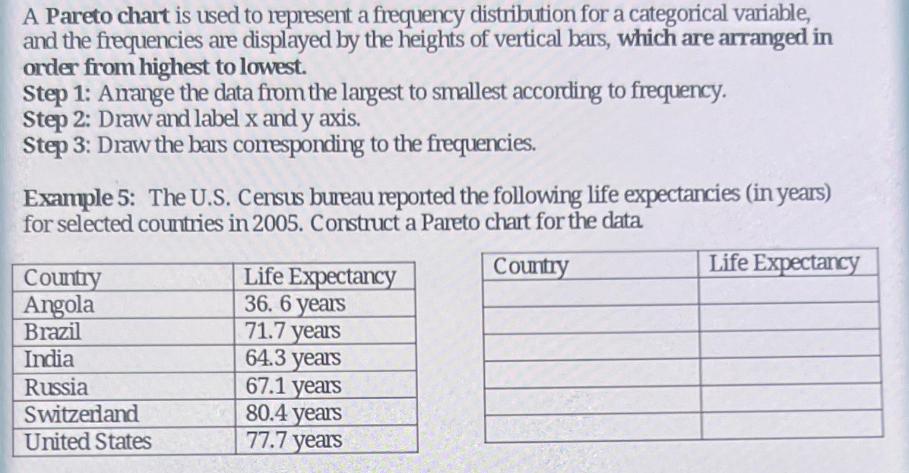
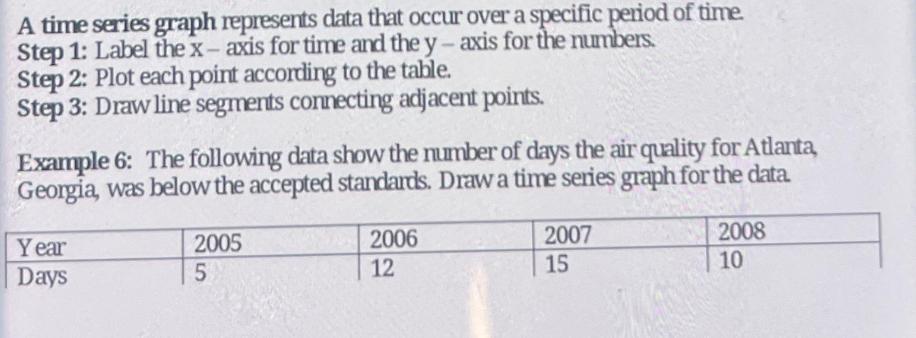
A Pareto chart is used to represent a frequency distribution for a categorical variable, and the...
Fantastic news! We've Found the answer you've been seeking!
Question:
Transcribed Image Text:
A Pareto chart is used to represent a frequency distribution for a categorical variable, and the frequencies are displayed by the heights of vertical bars, which are arranged in order from highest to lowest. Step 1: Arrange the data from the largest to smallest according to frequency. Step 2: Draw and label x and y axis. Step 3: Draw the bars corresponding to the frequencies. Example 5: The U.S. Census bureau reported the following life expectancies (in years) for selected countries in 2005. Construct a Pareto chart for the data Country Country Angola Brazil India Russia Switzerland United States Life Expectancy 36. 6 years 71.7 years 64.3 years 67.1 years 80.4 years 77.7 years Life Expectancy A time series graph represents data that occur over a specific period of time. Step 1: Label the x-axis for time and the y-axis for the numbers. Step 2: Plot each point according to the table. Step 3: Draw line segments connecting adjacent points. Example 6: The following data show the number of days the air quality for Atlanta, Georgia, was below the accepted standards. Draw a time series graph for the data. Year Days 2005 5 2006 12 2007 15 2008 10 A Pareto chart is used to represent a frequency distribution for a categorical variable, and the frequencies are displayed by the heights of vertical bars, which are arranged in order from highest to lowest. Step 1: Arrange the data from the largest to smallest according to frequency. Step 2: Draw and label x and y axis. Step 3: Draw the bars corresponding to the frequencies. Example 5: The U.S. Census bureau reported the following life expectancies (in years) for selected countries in 2005. Construct a Pareto chart for the data Country Country Angola Brazil India Russia Switzerland United States Life Expectancy 36. 6 years 71.7 years 64.3 years 67.1 years 80.4 years 77.7 years Life Expectancy A time series graph represents data that occur over a specific period of time. Step 1: Label the x-axis for time and the y-axis for the numbers. Step 2: Plot each point according to the table. Step 3: Draw line segments connecting adjacent points. Example 6: The following data show the number of days the air quality for Atlanta, Georgia, was below the accepted standards. Draw a time series graph for the data. Year Days 2005 5 2006 12 2007 15 2008 10
Expert Answer:
Related Book For
The Analysis Of Biological Data
ISBN: 9781319226237
3rd Edition
Authors: Michael C. Whitlock, Dolph Schluter
Posted Date:
Students also viewed these mathematics questions
-
Who is an ex-officio member?
-
The report Who Moves? Who Stays Put? Wheres Home? (Pew Social and Demographic Trends, December 17, 2008) gave the accompanying data for the 50 U.S. states on the percentage of the population that was...
-
Suppose a consumer lives in two periods , with his income in period 1 as $100 and his income in period 2 as $150. If the rate of interest in the economy is 12%. Find the equilibrium level of...
-
Assess the three procedures that are effective in identifying breakdowns in internal controls due to override and collusion. Choose which of three would be most difficult for the external auditor to...
-
A trader executes a ''bear spread'' on the Japanese yen consisting of a long PHLX 103 March put and a short PHLX 101 March put. a. If the price of the 103 put is 2.81(100ths of /), while the price of...
-
What is a unit root test and what are its consequences?
-
On August 1, 2010, Christy Co. treasurer signed a note promising to pay $121,500 on December 31, 2010. The proceeds of the note were $114,000.00 rev: 05-10-2011 19.value: 15.00 points You did NOT...
-
2. Does the following graph represent a function that satisfies the following conditions? (-1)=-3. lim fx) = 1 3+ 2+
-
Ray Flagg took out a 60-month fixed installment loan of $12,000 to open a new pet store. He paid no money down and began making monthly payments of $232. Ray's business does better than expected and...
-
Fifteen years ago a couple purchased a house for $190,000.00 by paying a 20% down payment and financing the remaining balance with a 30-year mortgage at 6.04% compounded monthly. (a) Find the monthly...
-
Leven furniture buys a living room set with a 5 9 0 0 list price and a 5 0 % trade discount freight FOB shipping $ . 4 5 is not part of the list price what is the delivery price including freight of...
-
A business had a + 1 0 % variance in cash flow from investing activities this year as compared to last year. The dollar amount of cash flow from investing activities last year was $ 9 0 0 , 0 0 0 ....
-
Computing and Comparing Income and Cash Flow MeasuresPenno Corporation recorded service revenues of $ 1 2 0 , 0 0 0 in 2 0 2 0 , of which $ 1 0 2 , 0 0 0 were on credit and $ 1 8 , 0 0 0 were for...
-
Jasper and Crewella Dahvill were married in year 0 . They filed joint tax returns in years 1 and 2 . In year 3 , their relationship was strained and Jasper insisted on filing a separate tax return....
-
A corporation is working on its cash budget for March. The budgeted beginning cash balance is $ 3 3 , 0 0 0 . Budgeted cash receipts total $ 1 8 2 . 0 0 0 and budgeted cash disbursements total $ 1 9...
-
In 20x1, ABC Co. was contracted to build a railroad. The contract price is equal to the construction costs incurred plus 20% thereof. However, if the project is completed within 4 years, ABC will...
-
Listed below are several terms and phrases associated with basic assumptions, broad accounting principles, and constraints. Pair each item from List A (by letter) with the item from List B that is...
-
The accompanying bar graph gives the relative frequency of letters in texts from the English language. Such charts are useful for deciphering simple codes. a. If a letter were chosen at random from a...
-
Michalsen et al. (2003) conducted a study to examine the effects of leech therapy for pain resulting from osteoarthritis of the knee. Two treatments were randomly assigned to 51 patients with...
-
Refer to Assignment Problem 25. a. Illustrate the (transformed) data in a graph. Add means and error bars showing standard errors of means. b. The table at the bottom of the page shows partial...
-
What is the value of equity at time zero? A. 44,055. B. 77,973. C. 122,027. Mun Hoe Yip is valuing Pure Corporation. Pure is a simple corporation that is going out of business in five years,...
-
Economic income during Year 1 is closest to: A. 23,186. B. 29,287. C. 46,101. Mun Hoe Yip is valuing Pure Corporation. Pure is a simple corporation that is going out of business in five years,...
-
What is residual income during Year 1? A. 2,916. B. 2,542. C. 8,653. Mun Hoe Yip is valuing Pure Corporation. Pure is a simple corporation that is going out of business in five years, distributing...
Study smarter with the SolutionInn App