

Question: Indicate which of the five payment options has the lowest break-even point and provide the break-even point in dollars and units. Option: BEPU: BEP$:
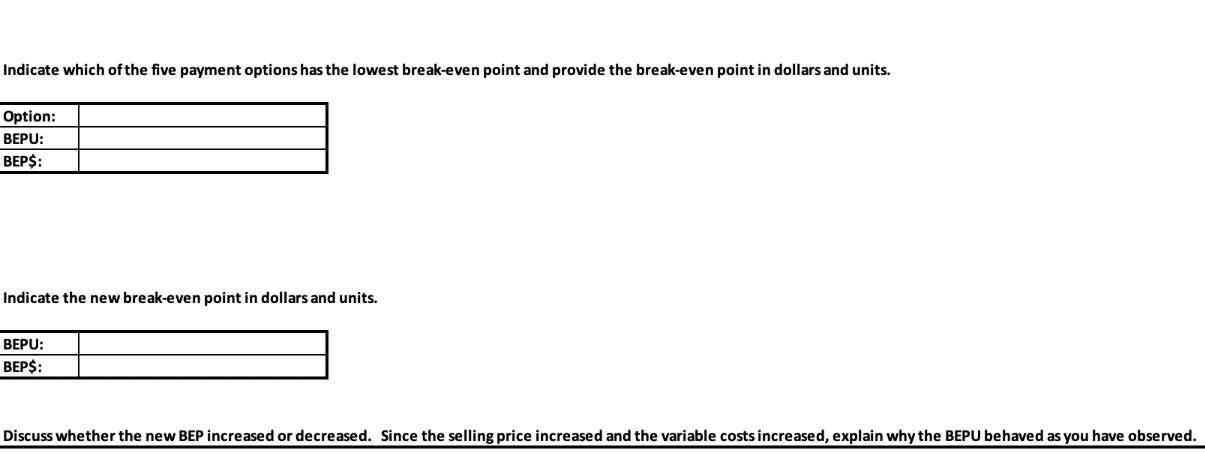
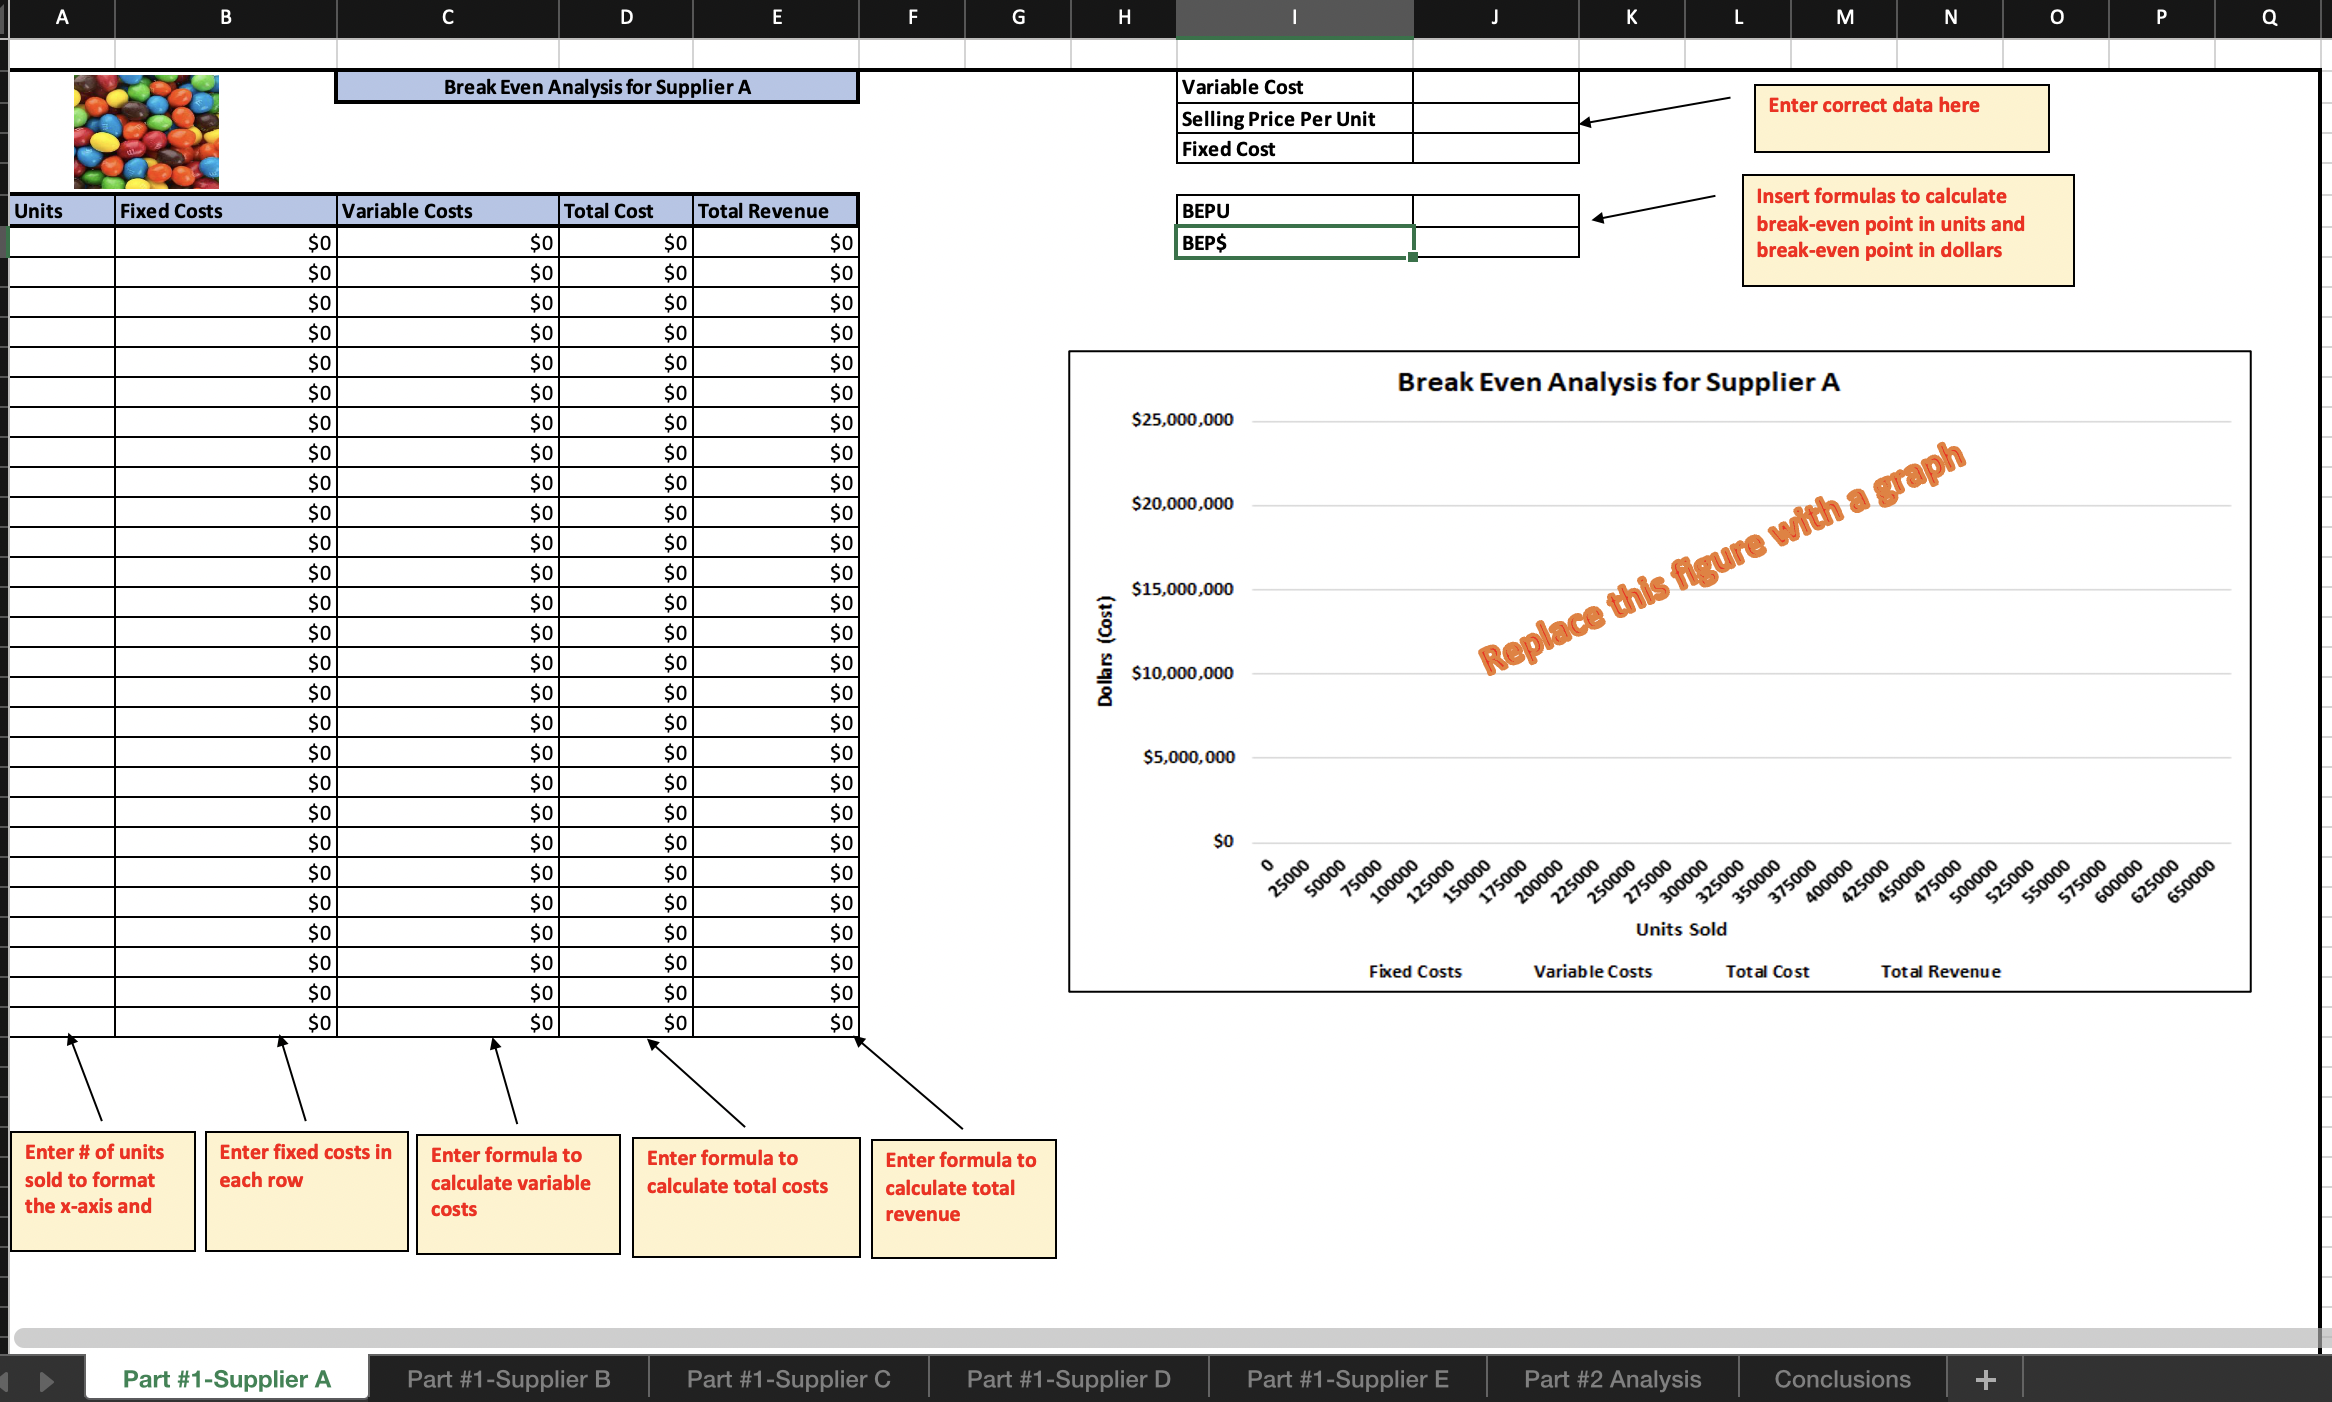
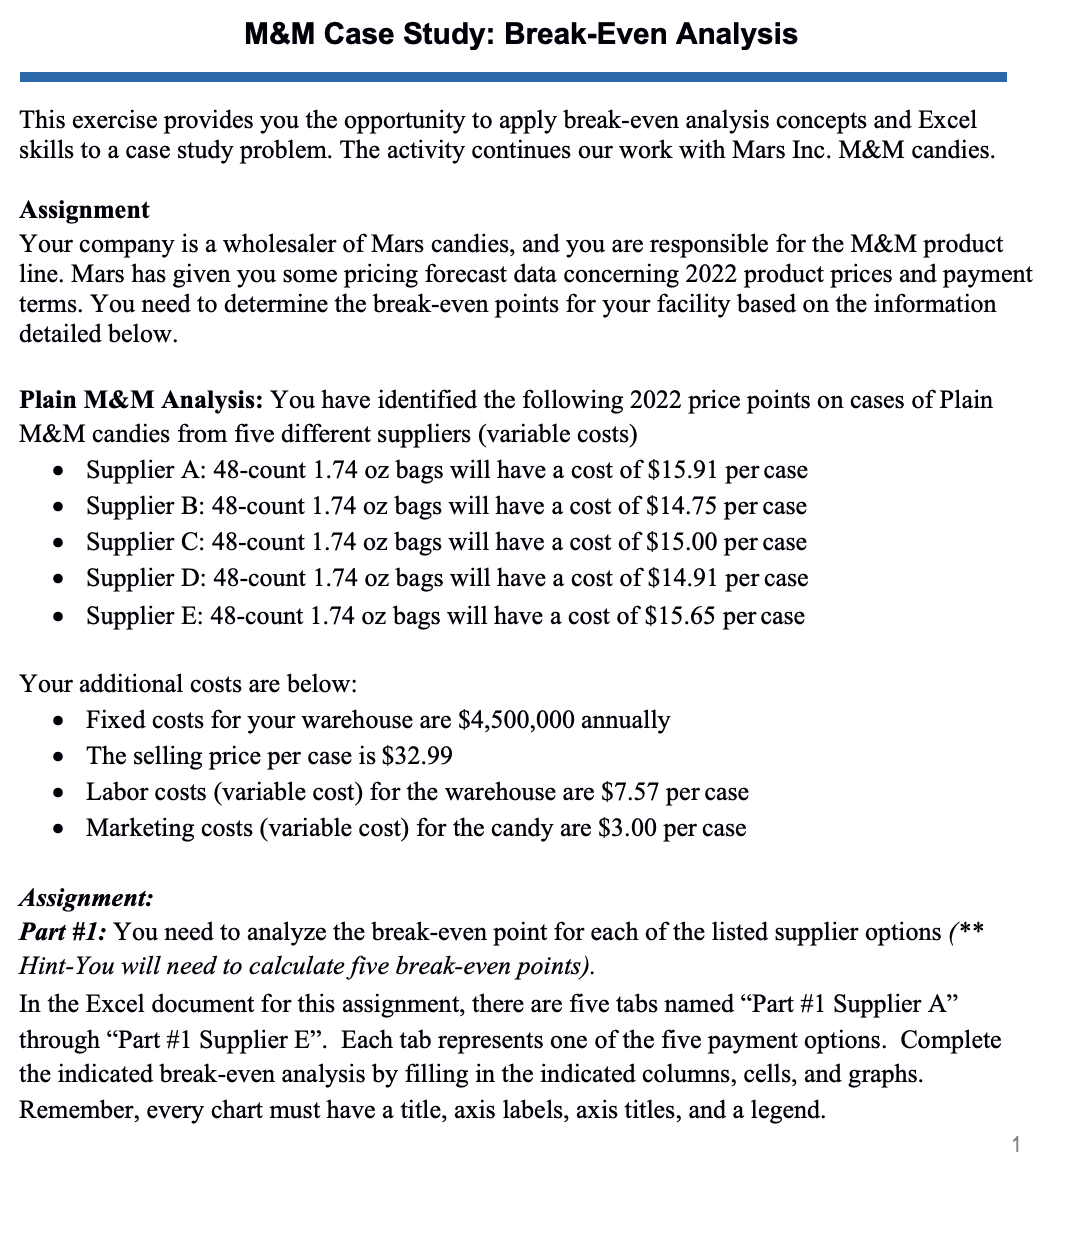
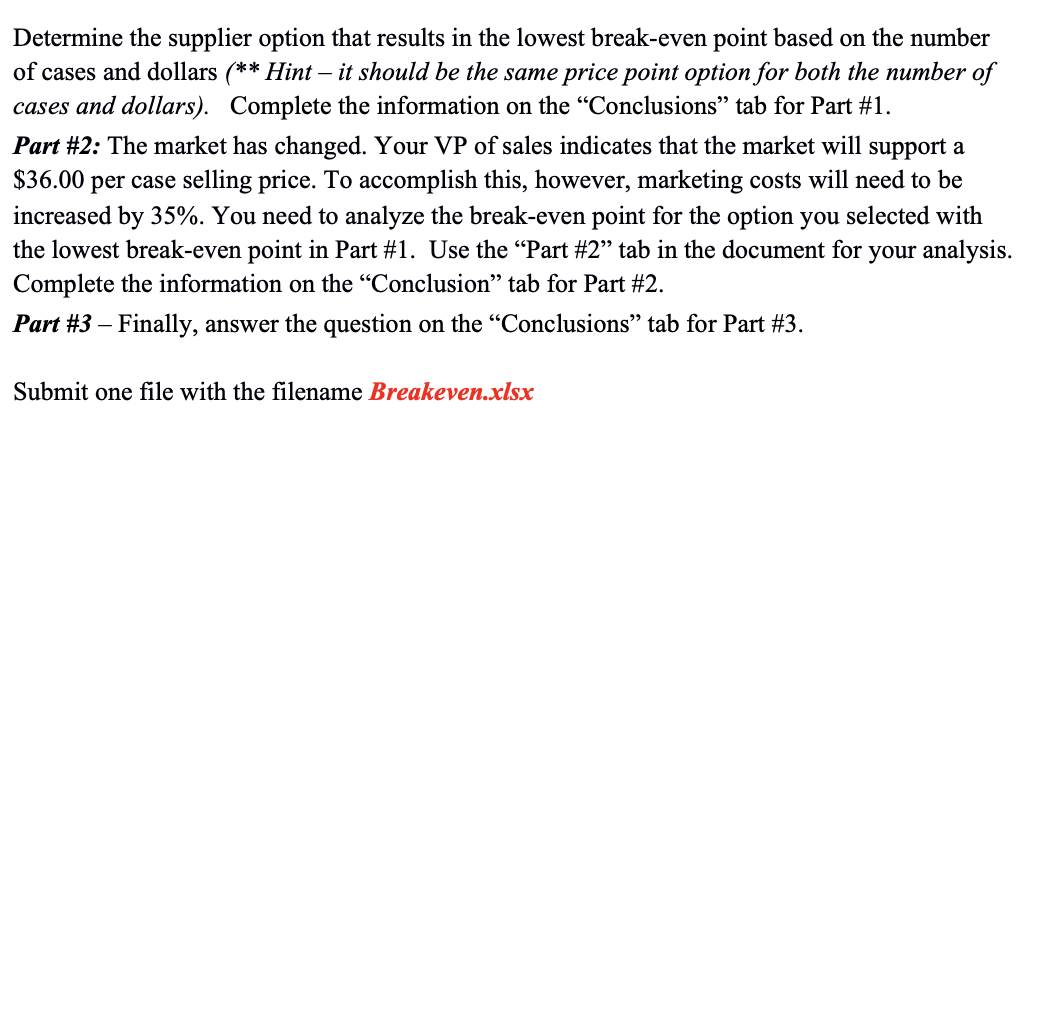
Indicate which of the five payment options has the lowest break-even point and provide the break-even point in dollars and units. Option: BEPU: BEP$: Indicate the new break-even point in dollars and units. BEPU: BEP$: Discuss whether the new BEP increased or decreased. Since the selling price increased and the variable costs increased, explain why the BEPU behaved as you have observed. A Units B Fixed Costs Enter # of units sold to format the x-axis and $0 $0 $0 $0 $0 $0 $0 $0 $0 $0 $0 $0 $0 $0 $0 $0 $0 $0 $0 $0 $0 $0 $0 $0 $0 $0 $0 Enter fixed costs in each row Part #1-Supplier A C Variable Costs Break Even Analysis for Supplier A $0 $0 $0 $0 $0 $0 $0 $0 $0 $0 $0 $0 $0 $0 $0 $0 $0 $0 $0 $0 $0 $0 $0 $0 $0 $0 $0 D Total Cost Enter formula to calculate variable costs Part #1-Supplier B $0 $0 $0 $0 $0 $0 $0 $0 $0 $0 $0 $0 $0 $0 $0 $0 $0 $0 $0 $0 $0 $0 $0 $0 $0 $0 $0 E Total Revenue Enter formula to calculate total costs $0 $0 $0 $0 $0 $0 $0 $0 $0 $0 $0 $0 $0 $0 $0 $0 $0 $0 $0 $0 $0 $0 $0 $0 $0 $0 $0 F Part #1-Supplier C G Enter formula to calculate total revenue Dollars (Cost) H Variable Cost Selling Price Per Unit Fixed Cost BEPU BEP$ $25,000,000 $20,000,000 $15,000,000 $10,000,000 Part #1-Supplier D $5,000,000 $0 0 25000 50000 75000 100000 125000 150000 Fixed Costs Break Even Analysis for Supplier A Part #1-Supplier E 175000 200000 K 225000 250000 Replace this figure with a graph 000542 Variable Costs 300000 L Units Sold 325000 Part #2 Analysis M Enter correct data here Insert formulas to calculate break-even point in units and break-even point in dollars 350000 375000 400000 425000 Total Cost N 450000 475000 500000 525000 Conclusions Total Revenue + O 550000 575000 600000 P 625000 650000 Q M&M Case Study: Break-Even Analysis This exercise provides you the opportunity to apply break-even analysis concepts and Excel skills to a case study problem. The activity continues our work with Mars Inc. M&M candies. Assignment Your company is a wholesaler of Mars candies, and you are responsible for the M&M product line. Mars has given you some pricing forecast data concerning 2022 product prices and payment terms. You need to determine the break-even points for your facility based on the information detailed below. Plain M&M Analysis: You have identified the following 2022 price points on cases of Plain M&M candies from five different suppliers (variable costs) Supplier A: 48-count 1.74 oz bags will have a cost of $15.91 per case Supplier B: 48-count 1.74 oz bags will have a cost of $14.75 per case Supplier C: 48-count 1.74 oz bags will have a cost of $15.00 per case Supplier D: 48-count 1.74 oz bags will have a cost of $14.91 per case Supplier E: 48-count 1.74 oz bags will have a cost of $15.65 per case Your additional costs are below: Fixed costs for your warehouse are $4,500,000 annually The selling price per case is $32.99 Labor costs (variable cost) for the warehouse are $7.57 per case Marketing costs (variable cost) for the candy are $3.00 per case Assignment: Part #1: You need to analyze the break-even point for each of the listed supplier options (** Hint-You will need to calculate five break-even points). In the Excel document for this assignment, there are five tabs named "Part #1 Supplier A" through "Part #1 Supplier E". Each tab represents one of the five payment options. Complete the indicated break-even analysis by filling in the indicated columns, cells, and graphs. Remember, every chart must have a title, axis labels, axis titles, and a legend. Determine the supplier option that results in the lowest break-even point based on the number of cases and dollars (** Hint - it should be the same price point option for both the number of cases and dollars). Complete the information on the "Conclusions" tab for Part #1. Part #2: The market has changed. Your VP of sales indicates that the market will support a $36.00 per case selling price. To accomplish this, however, marketing costs will need to be increased by 35%. You need to analyze the break-even point for the option you selected with the lowest break-even point in Part #1. Use the "Part #2" tab in the document for your analysis. Complete the information on the "Conclusion" tab for Part #2. Part #3 - Finally, answer the question on the "Conclusions" tab for Part #3. Submit one file with the filename Breakeven.xlsx
Step by Step Solution
There are 3 Steps involved in it
lets calculate the breakeven point for each supplier Supplier A Fixed Costs 4500000 Selling Price Pe... View full answer

Get step-by-step solutions from verified subject matter experts