

Question: A pharmaceutical company is developing and planning to launch a new oral drug for cancer. The product manager needs a 10 year forecast of net
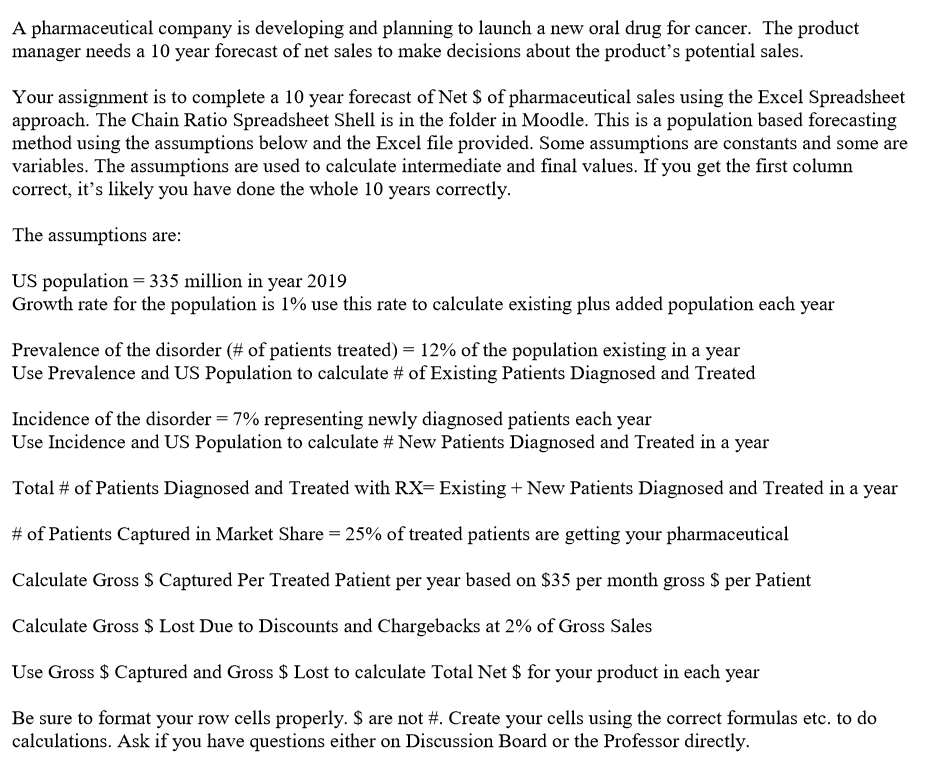
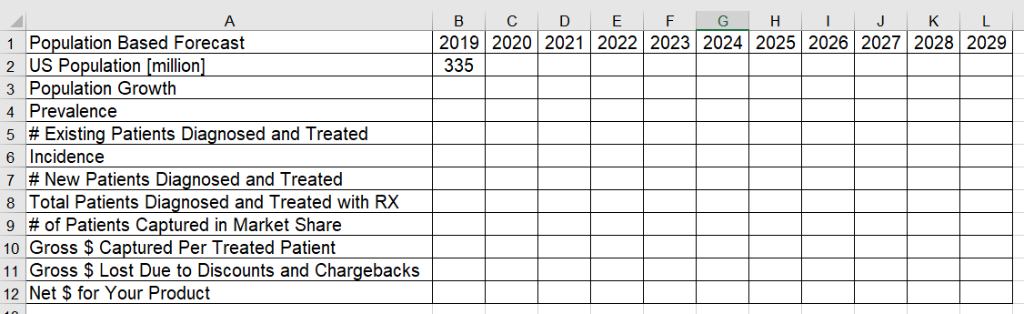
A pharmaceutical company is developing and planning to launch a new oral drug for cancer. The product manager needs a 10 year forecast of net sales to make decisions about the product's potential sales. Your assignment is to complete a 10 year forecast of Net $ of pharmaceutical sales using the Excel Spreadsheet approach. The Chain Ratio Spreadsheet Shell is in the folder in Moodle. This is a population based forecasting method using the assumptions below and the Excel file provided. Some assumptions are constants and some are variables. The assumptions are used to calculate intermediate and final values. If you get the first column correct, it's likely you have done the whole 10 years correctly. The assumptions are: US population =335 million in year 2019 Growth rate for the population is 1% use this rate to calculate existing plus added population each year Prevalence of the disorder (#of patients treated) 12% of the population existing in a year Use Prevalence and US Population to calculate # of Existing Patients Diagnosed and Treated Incidence of the disorder = 7% representing newly diagnosed patients each year Use Incidence and US Population to calculate #New Patients Diagnosed and Treated in a year Total of Patients Diagnosed and Treated with RX= Existing New Patients Diagnosed and Treated in a year of Patients Captured in Market Share = 25% of treated patients getting your pharmaceutical are Calculate Gross $ Captured Per Treated Patient per year based on $35 per month gross $ per Patient Calculate Gross $ Lost Due to Discounts and Chargebacks at 2% of Gross Sales Use Gross $ Captured and Gross $ Lost to calculate Total Net $ for your product in each year Be sure to format your row cells properly. $ are not #. Create your cells using the correct formulas etc. to do calculations. Ask if you have questions either on Discussion Board or the Professor directly B A C H K L Population Based Forecast 2 US Population [million] 3 Population Growth 2019 2020 2021 | 2022 | 2023 2024|2025 2026 2027 20282029 335 1 4 Prevalence 5 Existing Patients Diagnosed and Treated 6 Incidence 7 New Patients Diagnosed and Treated 8 Total Patients Diagnosed and Treated with RX 9 #of Patients Captured in Market Share 10 Gross $ Captured Per Treated Patient 11 Gross $ Lost Due to Discounts and Chargebacks 12 Net $ for Your Product
Step by Step Solution
There are 3 Steps involved in it

Get step-by-step solutions from verified subject matter experts