

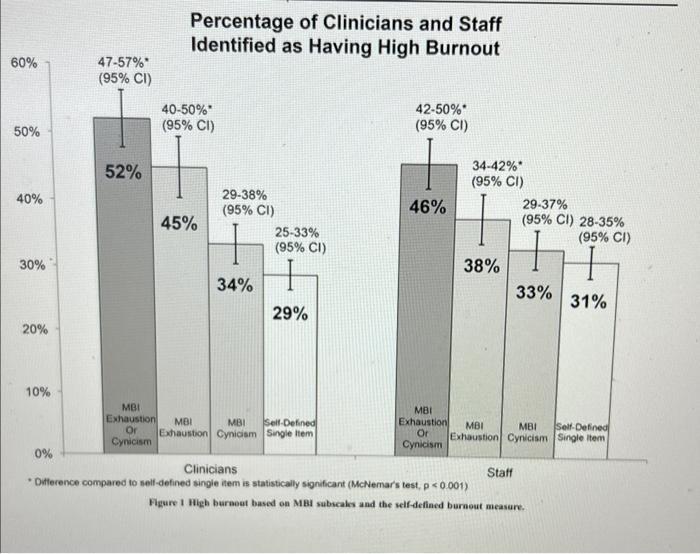
1. describe the data displayed in the bar graph(co sider class, size, class width, total frequency, list...
Fantastic news! We've Found the answer you've been seeking!
Question:
2. Draw a conclusion about the data from the graph distribution in the context of the article.
3.How else might this data have been displayed? Discuss the pros and cons of 2 other presentation options such as tables or sifferent graphical displays. Why do you think those two other presentation option were not used?
Expert Answer:
Answer 1 The bar graph displays the percentage of clinicians and staff identified as having high burnout on the MBI subscales and the selfdefined burn... View the full answer

Related Book For 

College Accounting
ISBN: 978-1111528126
11th edition
Authors: Tracie Nobles, Cathy Scott, Douglas McQuaig, Patricia Bille
Posted Date:
