

Question: A planned Cargo Network is illustrated in Figure 1, while Table 1 shows the flight times between two cities (nodes). Task 1(10%) Apply the network
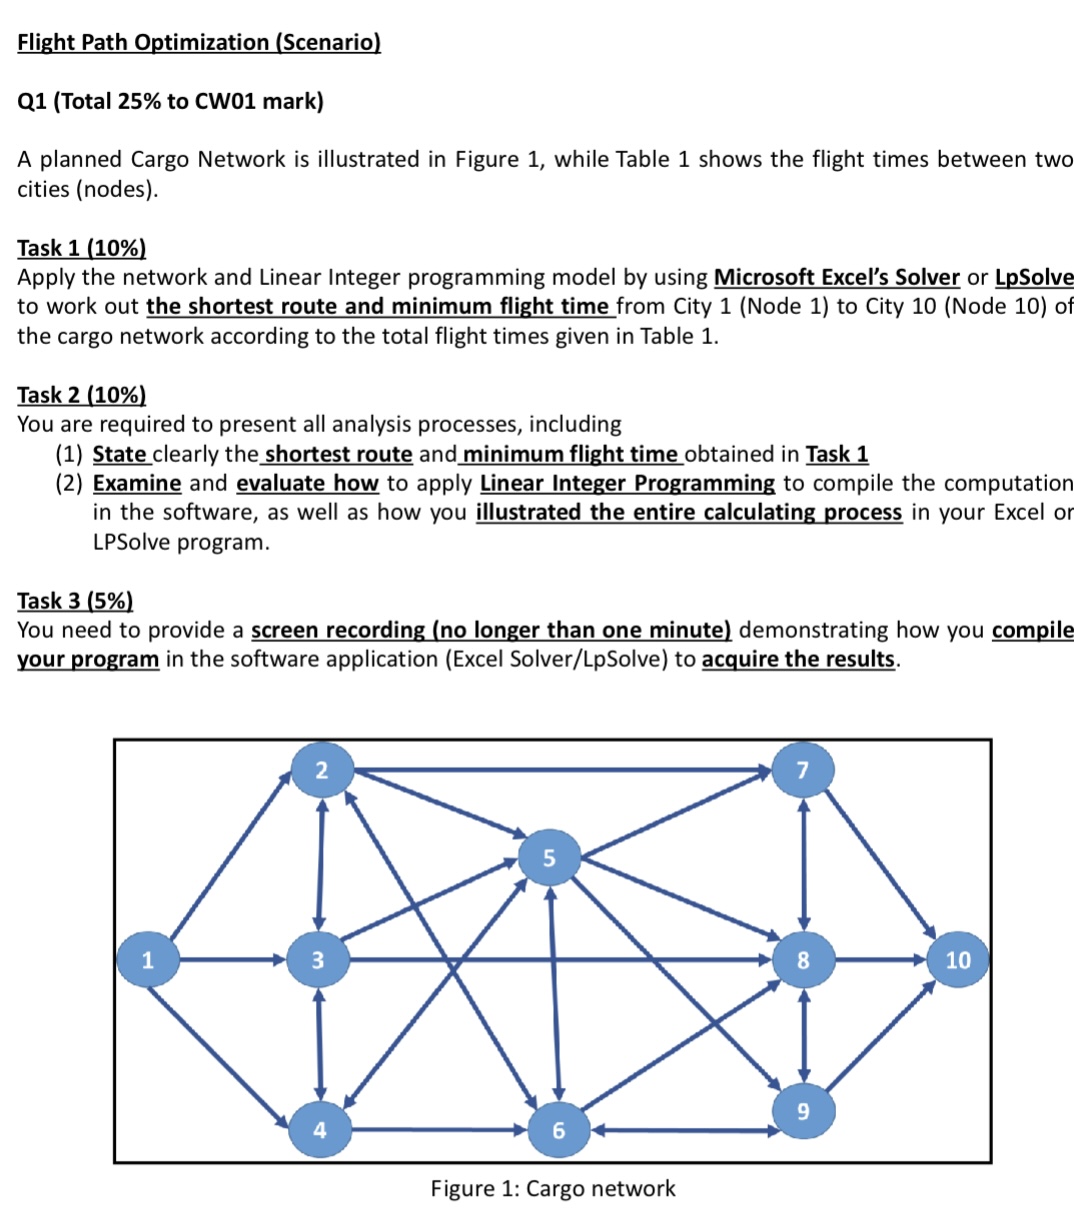
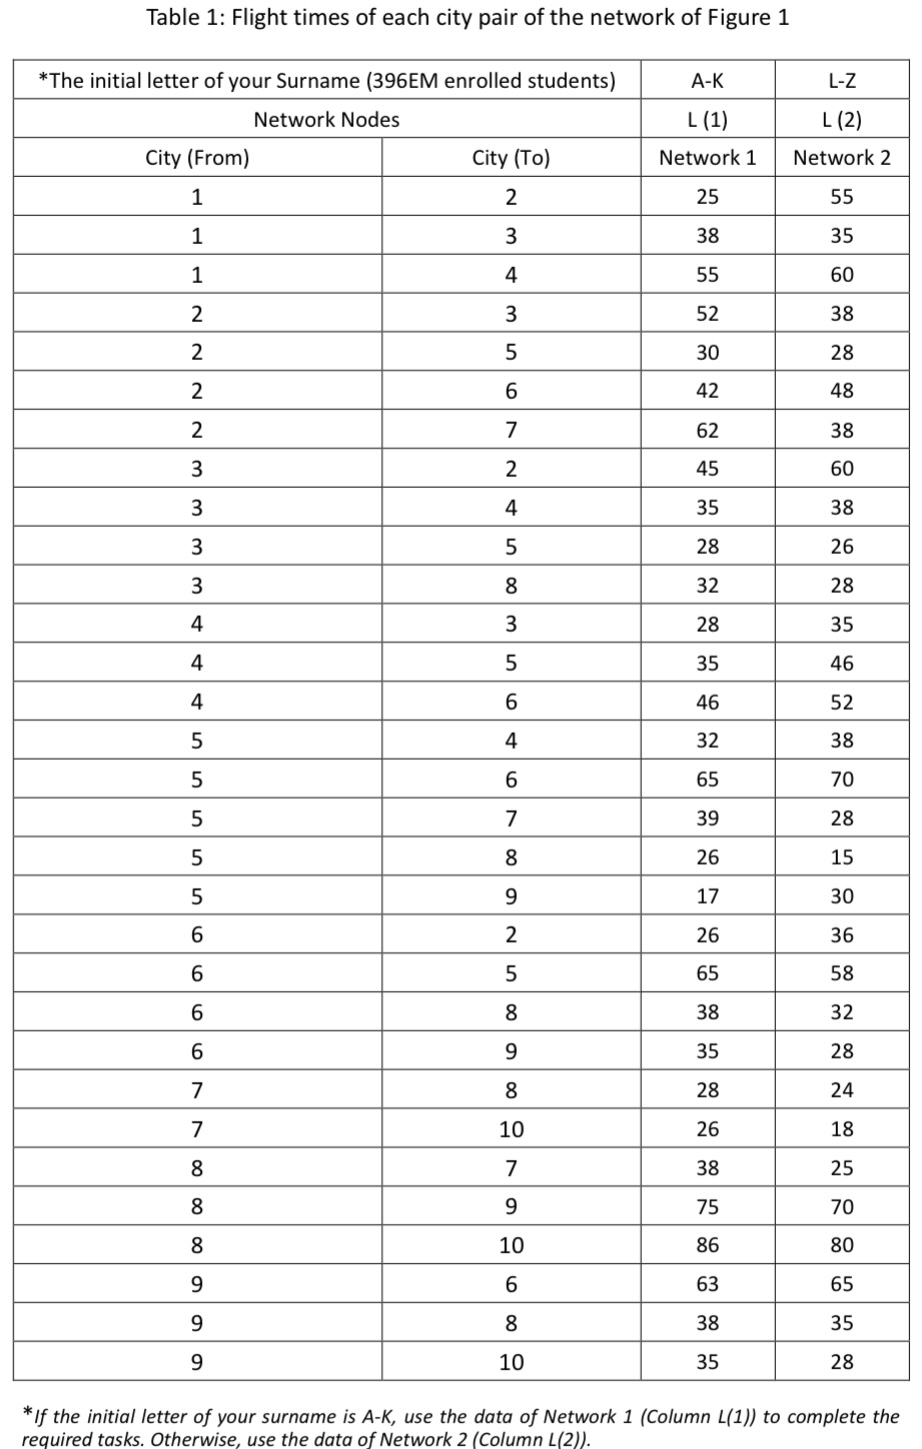
A planned Cargo Network is illustrated in Figure 1, while Table 1 shows the flight times between two cities (nodes). Task 1(10%) Apply the network and Linear Integer programming model by using Microsoft Excel's Solver or LpSolve to work out the shortest route and minimum flight time from City 1 (Node 1) to City 10 (Node 10) of the cargo network according to the total flight times given in Table 1. Task 2(10%) You are required to present all analysis processes, including (1) State clearly the shortest route and minimum flight time obtained in Task 1 (2) Examine and evaluate how to apply Linear Integer Programming to compile the computation in the software, as well as how you illustrated the entire calculating process in your Excel or LPSolve program. Task 3(5%) You need to provide a screen recording (no longer than one minute) demonstrating how you compile your program in the software application (Excel Solver/LpSolve) to acquire the results. rigure 1 : Largo network Table 1: Flight times of each city pair of the network of Figure 1 required tasks. Otherwise, use the data of Network 2 (Column L(2))
Step by Step Solution
There are 3 Steps involved in it

Get step-by-step solutions from verified subject matter experts