

Question: A. Plot in Excel the opportunity set for Portfolios A & B using the information found in the found in the Excel spreadsheet that accompanies
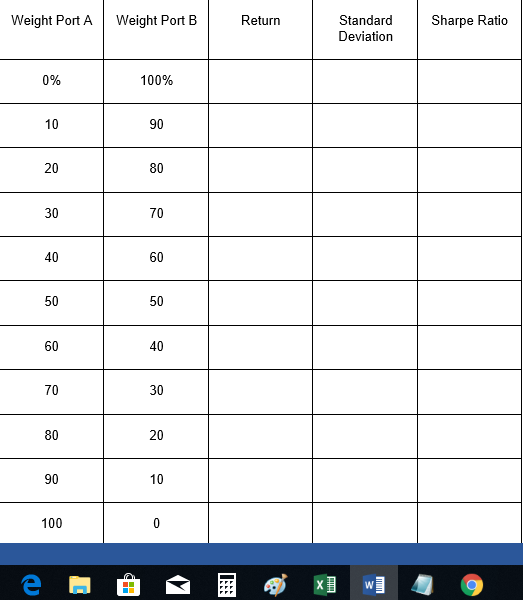
A. Plot in Excel the opportunity set for Portfolios A & B using the information found in the found in the Excel spreadsheet that accompanies the case using weights of portfolio A & B in 10 percentage point increment.
B. Determine the optimal risky portfolio (e.g. the optimal allocation of A & B) using the concepts from Modern Portfolio Theory and draw in the Capital Allocation Line (CAL). The approximate optimal allocation can be determined using the table in Excel like the one shown above
.
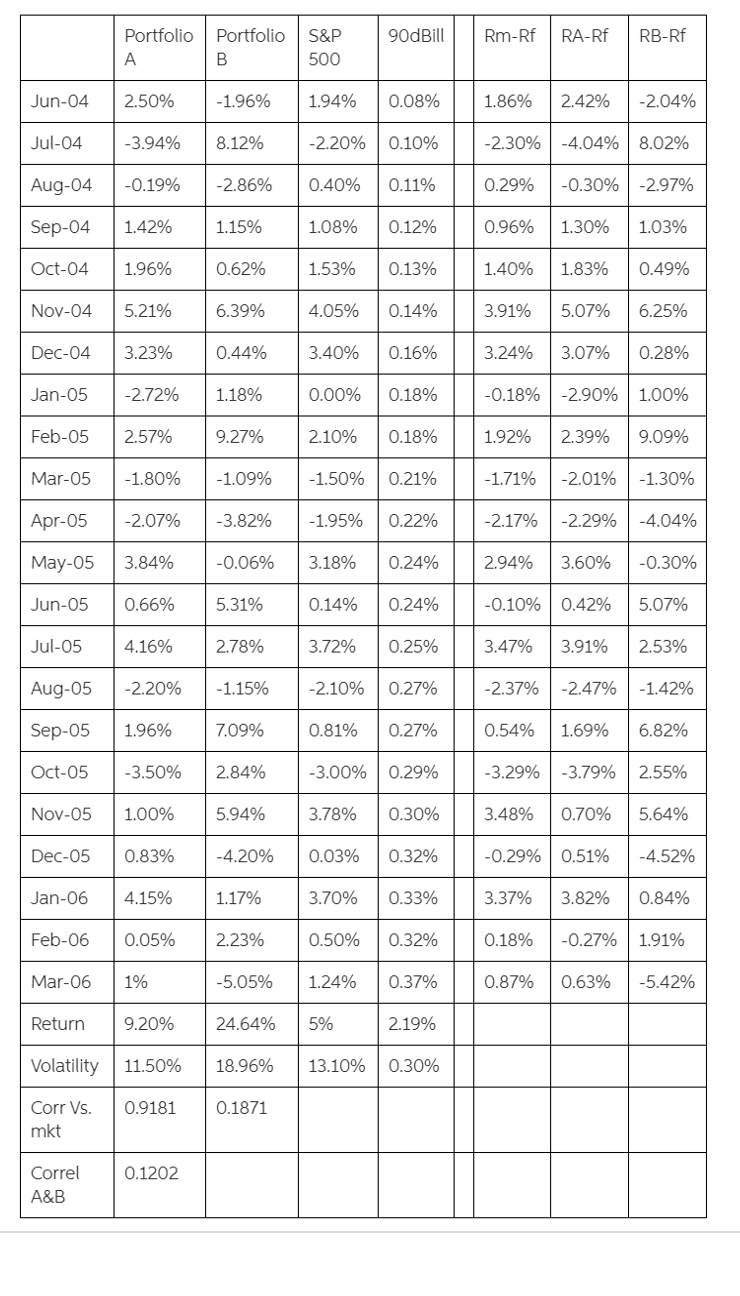
90dBill Rm-Rf RA-Rf RB-Rf Portfolio Portfolio A B S&P 500 Jun-04 2.50% -1.96% 1.94% 0.08% 1.86% 2.42% -2.04% Jul-04 -3.94% 8.12% -2.20% 0.10% -2.30% -4.04% 8.02% Aug-04 -0.19% -2.86% 0.40% 0.11% 0.29% -0.30% -2.97% Sep-04 1.42% 1.15% 1.08% 0.12% 0.96% 1.30% 1.03% Oct-04 1.96% 0.62% 1.53% 0.13% 1.40% 1.83% 0.49% Nov-04 5.21% 6.39% 4.05% 0.14% 3.91% 5.07% 6.25% Dec-04 3.23% 0.44% 3.40% 0.16% 3.24% 3.07% 0.28% Jan-05 -2.72% 1.18% 0.00% 0.18% -0.18% -2.90% 1.00% Feb-05 2.57% 9.27% 2.10% 0.18% 1.92% 2.39% 9.09% Mar-05 -1.80% -1.09% -1.50% 0.21% -1.71% -2.01% -1.30% Apr-05 -2.07% -3.82% -1.95% 0.22% -2.17% -2.29% -4.04% May-05 3.84% -0.06% 3.18% 0.24% 2.94% 3.60% -0.30% Jun-05 0.66% 5.31% 0.14% 0.24% -0.10% 0.42% 5.07% Jul-05 4.16% 2.78% 3.72% 0.25% 3.47% 3.91% 2.53% Aug-05 -2.20% -1.15% -2.10% 0.27% -2.37% -2.47% -1.42% Sep-05 1.96% 7.09% 0.81% 0.27% 0.54% 1.69% 6.82% Oct-05 -3.50% 2.84% -3.00% 0.29% -3.29% -3.79% 2.55% Nov-05 1.00% 5.94% 3.78% 0.30% 3.48% 0.70% 5.64% Dec-05 0.83% -4.20% 0.03% 0.32% -0.29% 0.51% -4.52% Jan-06 4.15% 1.17% 3.70% 0.33% 3.37% 3.82% 0.84% Feb-06 0.05% 2.23% 0.50% 0.32% 0.18% -0.27% 1.91% Mar-06 1% -5.05% 1.24% 0.37% 0.87% 0.63% -5.42% Return 9.20% 24.64% 5% 2.19% Volatility 11.50% 18.96% 13.10% 0.30% 0.9181 0.1871 Corr Vs. mkt 0.1202 Correl A&B Weight Port A Weight Port B Return Standard Deviation Sharpe Ratio 0% 100% 10 90 20 80 30 70 40 60 50 50 60 40 70 30 80 20 90 10 100 e HE W
Step by Step Solution
There are 3 Steps involved in it

Get step-by-step solutions from verified subject matter experts