

Question: A plot of the wave function for a particle is shown in the diagram below. (X) (a) At which values of x is the particle
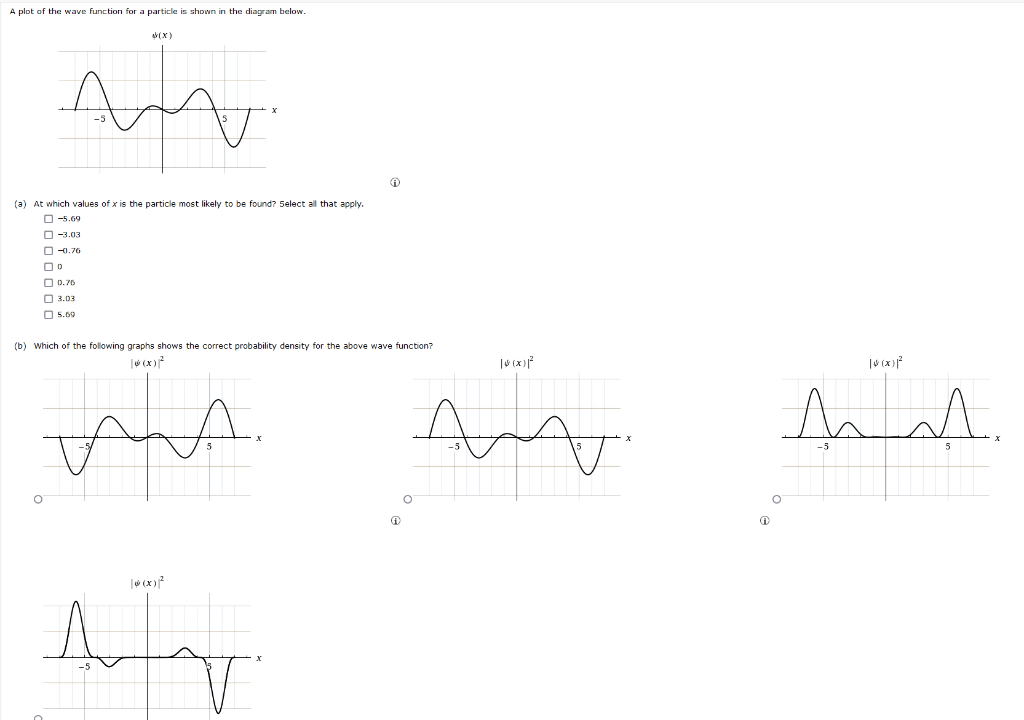
A plot of the wave function for a particle is shown in the diagram below. "(X) (a) At which values of x is the particle most likely to be found? Select all that apply. 0 -5.69 0 -3.03 0 -0.76 0 0.76 0 3.03 5.69 (b) which of the following graphs shows the correct probability density for the above wave function? V -5 O O
Step by Step Solution
There are 3 Steps involved in it
1 Expert Approved Answer
Step: 1 Unlock

Question Has Been Solved by an Expert!
Get step-by-step solutions from verified subject matter experts
Step: 2 Unlock
Step: 3 Unlock