

Question: a. Plot the cumulative probability distributions for the Yes and No investment decisions. b. What is the probability that you will lose money? c. Would
a. Plot the cumulative probability distributions for the Yes and No investment decisions.
b. What is the probability that you will lose money?
c. Would you recommend this decision? Why or why not?
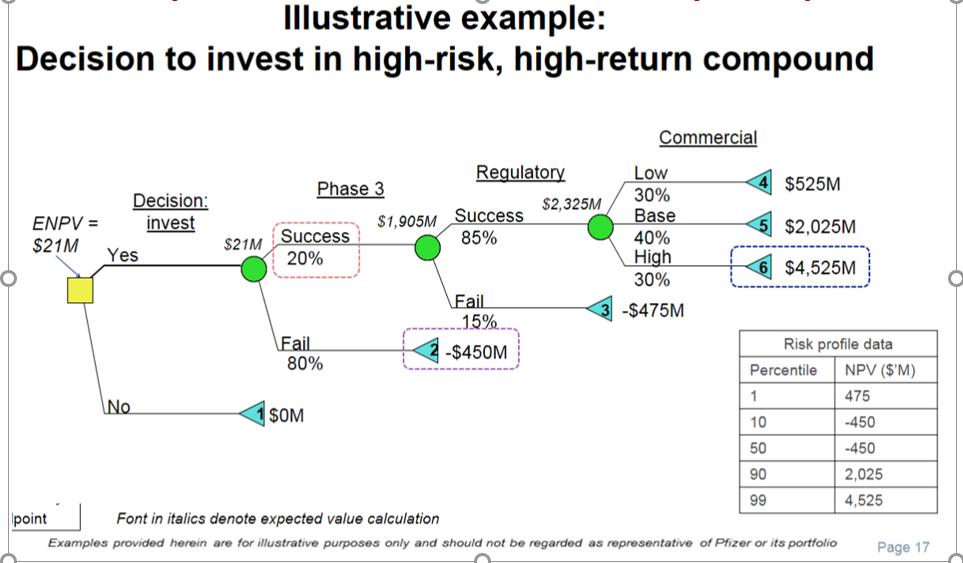
Illustrative example: Decision to invest in high-risk, high-return compound Commercial Regulatory Low Phase 3 $525M Decision: invest 30% Base $2,325M $1,905M Success 85% ENPV = $2,025M Success 40% High 30% $21M $21M Yes 20% $4,525M Fail 15% -$475M \Fail 80% Risk profile data -$450M Percentile NPV ($'M) 475 \No. $OM 10 -450 50 -450 90 2,025 99 4,525 Ipoint Font in italics denote expected value calculation Examples provided herein are for illustrative purposes only and should not be regarded as representative of Pfizer or its portfolio Page 17
Step by Step Solution
3.40 Rating (147 Votes )
There are 3 Steps involved in it
The probability formula provides the ratio of the number of favorable outcomes to the total number o... View full answer

Get step-by-step solutions from verified subject matter experts