

Question: (a) Plot the E-k diagram for a free electron using Matlab. Label the axes with correct units and add a graph title. Include your name
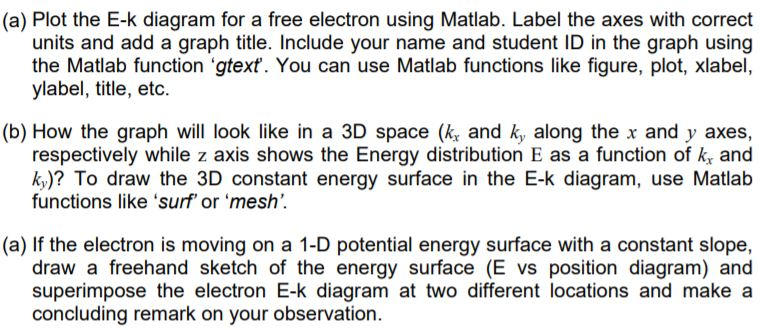
(a) Plot the E-k diagram for a free electron using Matlab. Label the axes with correct units and add a graph title. Include your name and student ID in the graph using the Matlab function 'gtext. You can use Matlab functions like figure, plot, xlabel, ylabel, title, etc. (b) How the graph will look like in a 3D space (ky and ky along the x and y axes, respectively while z axis shows the Energy distribution E as a function of ky and ky)? To draw the 3D constant energy surface in the E-k diagram, use Matlab functions like 'surf' or 'mesh'. (a) If the electron is moving on a 1-D potential energy surface with a constant slope, draw a freehand sketch of the energy surface (E vs position diagram) and superimpose the electron E-k diagram at two different locations and make a concluding remark on your observation. (a) Plot the E-k diagram for a free electron using Matlab. Label the axes with correct units and add a graph title. Include your name and student ID in the graph using the Matlab function 'gtext. You can use Matlab functions like figure, plot, xlabel, ylabel, title, etc. (b) How the graph will look like in a 3D space (ky and ky along the x and y axes, respectively while z axis shows the Energy distribution E as a function of ky and ky)? To draw the 3D constant energy surface in the E-k diagram, use Matlab functions like 'surf' or 'mesh'. (a) If the electron is moving on a 1-D potential energy surface with a constant slope, draw a freehand sketch of the energy surface (E vs position diagram) and superimpose the electron E-k diagram at two different locations and make a concluding remark on your observation
Step by Step Solution
There are 3 Steps involved in it

Get step-by-step solutions from verified subject matter experts