

Question: a. Plot the qqline and boxplot of the data. Also get the skewness. What is your conclusion about the d b. Do a log transformation
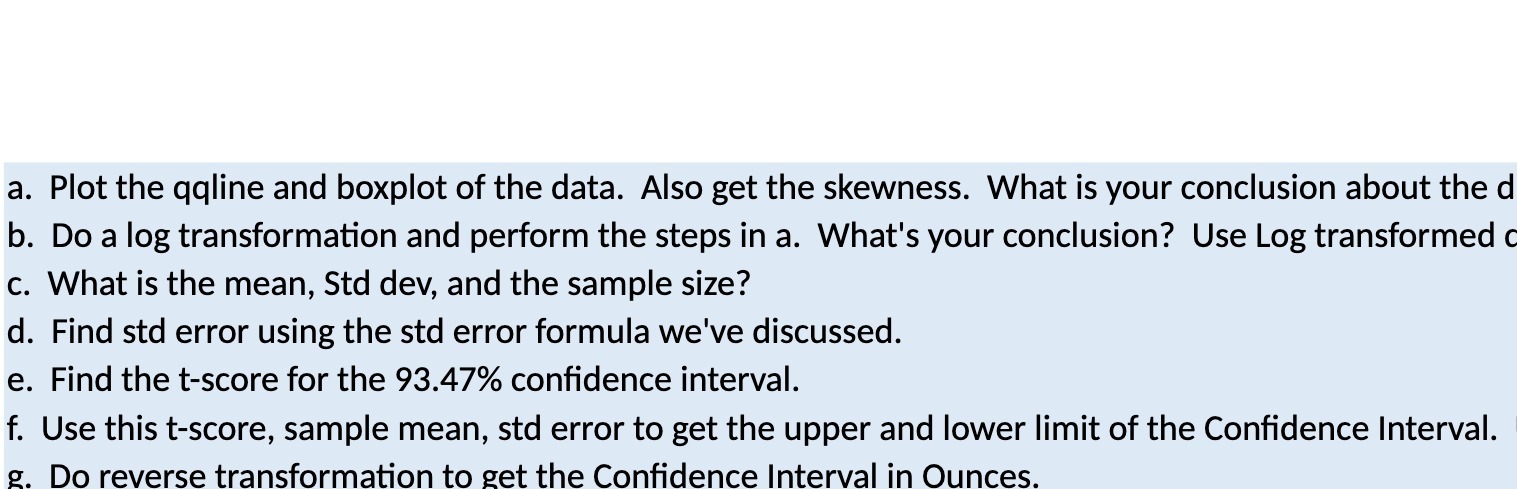
a. Plot the qqline and boxplot of the data. Also get the skewness. What is your conclusion about the d b. Do a log transformation and perform the steps in a. What's your conclusion? Use Log transformed c c. What is the mean, Std dev, and the sample size? d. Find std error using the std error formula we've discussed. e. Find the t-score for the 93.47% condence interval. f. Use this tscore, sample mean, std error to get the upper and lower limit of the Condence Interval. ' 2. Do reverse transformation to get the Condence Interval in Ounces
Step by Step Solution
There are 3 Steps involved in it
1 Expert Approved Answer
Step: 1 Unlock

Question Has Been Solved by an Expert!
Get step-by-step solutions from verified subject matter experts
Step: 2 Unlock
Step: 3 Unlock