

Question: (a) Plot y(t) and z(t) on the same graph, for 1st5 (with 1000 data points), such that y(t) = 3e-0.5t cos(x) z(t) = 2
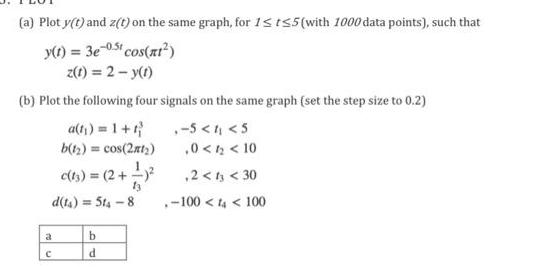
(a) Plot y(t) and z(t) on the same graph, for 1st5 (with 1000 data points), such that y(t) = 3e-0.5t cos(x) z(t) = 2 - Y(1) (b) Plot the following four signals on the same graph (set the step size to 0.2) a(t) = 1 + t} .-5 < 1,
Step by Step Solution
★★★★★
3.36 Rating (159 Votes )
There are 3 Steps involved in it
1 Expert Approved Answer
Step: 1 Unlock

Solutions Answer Question 5a The following is the Octave script to plot the given ... View full answer
Question Has Been Solved by an Expert!
Get step-by-step solutions from verified subject matter experts
Step: 2 Unlock
Step: 3 Unlock