

Question: . A population is known to be normally distributed with a standard deviation of 2.8. (a) Compute the 95% confidence interval on the mean based
. A population is known to be normally distributed with a standard deviation of
2.8. (a) Compute the 95% confidence interval on the mean based on the
following sample of nine: 8, 9, 10, 13, 14, 16, 17, 20, 21. (b) Now compute the
99% confidence interval using the same data.
12. A person claims to be able to predict the outcome of flipping a coin. This
person is correct 16/25 times. Compute the 95% confidence interval on the
proportion of times this person can predict coin flips correctly. What
conclusion can you draw about this test of his ability to predict the future?
13. What does it mean that the variance (computed by dividing by N) is a biased
statistic?
14. A confidence interval for the population mean computed from an N of 16
ranges from 12 to 28. A new sample of 36 observations is going to be taken.
You can't know in advance exactly what the confidence interval will be
because it depends on the random sample. Even so, you should have some idea
of what it will be. Give your best estimation.
15. You take a sample of 22 from a population of test scores, and the mean of your
sample is 60. (a) You know the standard deviation of the population is 10.
What is the 99% confidence interval on the population mean. (b) Now assume
that you do not know the population standard deviation, but the standard
deviation in your sample is 10. What is the 99% confidence interval on the
mean now?
16. You read about a survey in a newspaper and find that 70% of the 250 people
sampled prefer Candidate A. You are surprised by this survey because you
thought that more like 50% of the population preferred this candidate. Based
on this sample, is 50% a possible population proportion? Compute the 95%
confidence interval to be sure.
17. Heights for teenage boys and girls were calculated. The mean height for the
sample of 12 boys was 174 cm and the variance was 62. For the sample of 12
girls, the mean was 166 cm and the variance was 65. Assuming equal variances
and normal distributions in the population, (a) What is the 95% confidence
interval on the difference between population means? (b) What is the 99%
If numerous samples of N = 15 are taken from a uniform distribution and a
relative frequency distribution of the means is drawn, what would be the shape of
the frequency distribution?
8. A normal distribution has a mean of 20 and a standard deviation of 10. Two
scores are sampled randomly from the distribution and the second score is
subtracted from the first. What is the probability that the difference score will be
greater than 5? Hint: Read the Variance Sum Law section of Chapter 3.
9. What is the shape of the sampling distribution of r? In what way does the shape
depend on the size of the population correlation?
10. If you sample one number from a standard normal distribution, what is the
probability it will be 0.5?
11. A variable is normally distributed with a mean of 120 and a standard deviation
of 5. Four scores are randomly sampled. What is the probability that the mean
of the four scores is above 127?
12. The correlation between self-esteem and extraversion is .30. A sample of 84 is
taken. a. What is the probability that the correlation will be less than 0.10? b.
What is the probability that the correlation will be greater than 0.25?
13. The mean GPA for students in School A is 3.0; the mean GPA for students in
School B is 2.8. The standard deviation in both schools is 0.25. The GPAs of
both schools are normally distributed. If 9 students are randomly sampled from
each school, what is the probability that:
a. the sample mean for School A will exceed that of School B by 0.5 or more?
b. the sample mean for School B will be greater than the sample mean for
School A?
14. In a city, 70% of the people prefer Candidate A. Suppose 30 people from this
city were sampled.
a. What is the mean of the sampling distribution of p?
b. What is the standard error of p?
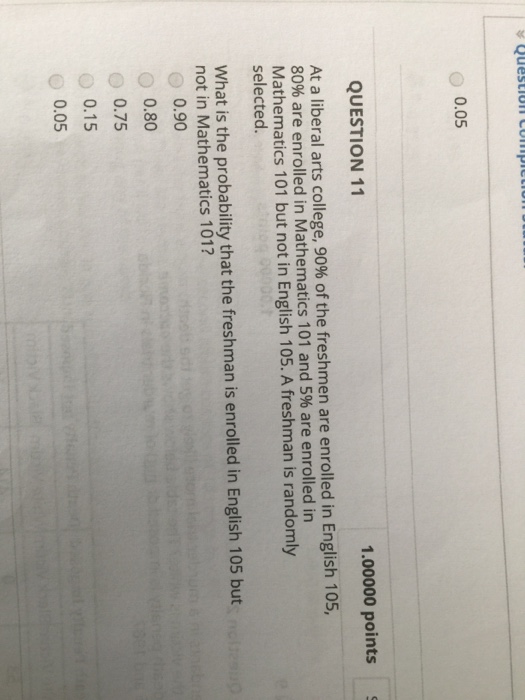
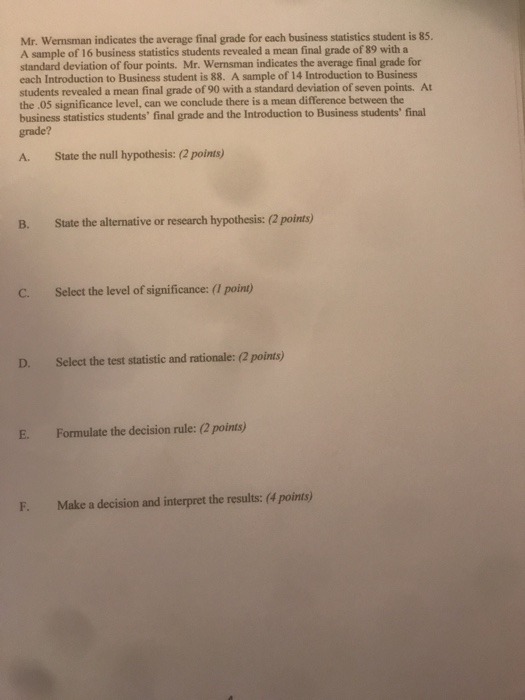
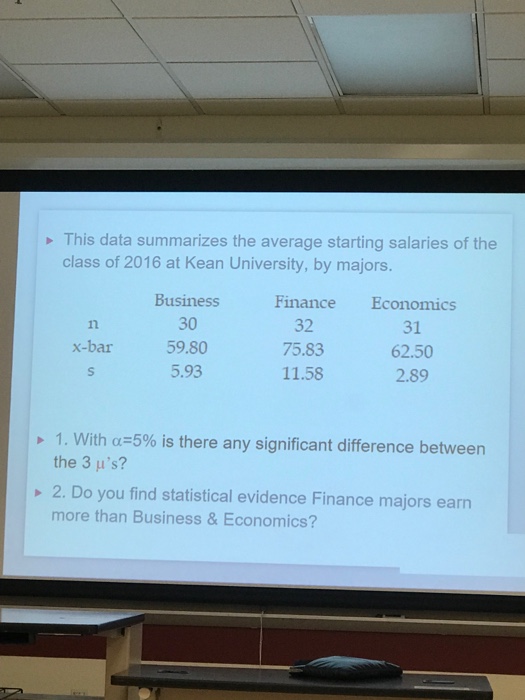
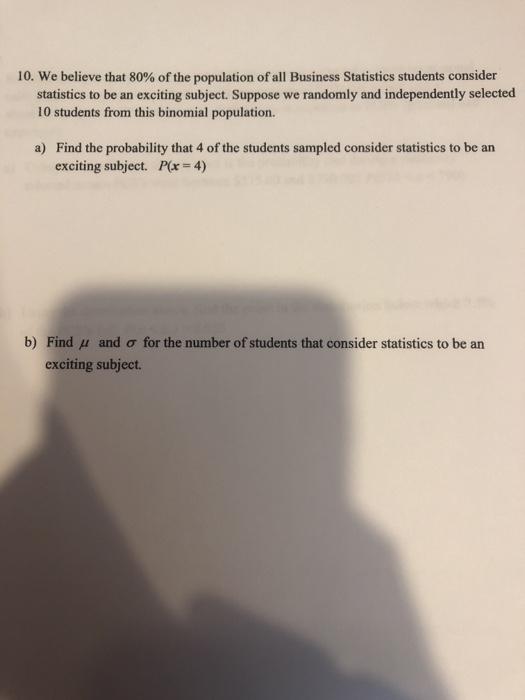
0.05 QUESTION 11 1.00000 points At a liberal arts college, 90% of the freshmen are enrolled in English 105, 80% are enrolled in Mathematics 101 and 5% are enrolled in Mathematics 101 but not in English 105. A freshman is randomly selected. What is the probability that the freshman is enrolled in English 105 but not in Mathematics 101? noljesup 0.90 O 0.80 O 0.75 0.15 0.05Mr. Wernsman indicates the average final grade for each business statistics student is 85. A sample of 16 business statistics students revealed a mean final grade of 89 with a standard deviation of four points. Mr. Wernsman indicates the average final grade for each Introduction to Business student is 88. A sample of 14 Introduction to Business students revealed a mean final grade of 90 with a standard deviation of seven points. At the .05 significance level, can we conclude there is a mean difference between the business statistics students' final grade and the Introduction to Business students' final grade? A. State the null hypothesis: (2 points) B. State the alternative or research hypothesis: (2 points) C. Select the level of significance: (I point) D. Select the test statistic and rationale: (2 points) E. Formulate the decision rule: (2 points) F. Make a decision and interpret the results: (4 points)This data summarizes the average starting salaries of the class of 2016 at Kean University, by majors. Business Finance Economics 30 32 31 x-bar 59.80 75.83 62.50 S 5.93 11.58 2.89 1. With a=5% is there any significant difference between the 3 ul's? 2. Do you find statistical evidence Finance majors earn more than Business & Economics?10. We believe that 80% of the population of all Business Statistics students consider statistics to be an exciting subject. Suppose we randomly and independently selected 10 students from this binomial population. a) Find the probability that 4 of the students sampled consider statistics to be an exciting subject. P(x = 4) b) Find # and o for the number of students that consider statistics to be an exciting subject
Step by Step Solution
There are 3 Steps involved in it

Get step-by-step solutions from verified subject matter experts