

Question: . A population is modeled by the equation da = ka (a - x) , where a and k are positive constants. Which graph best

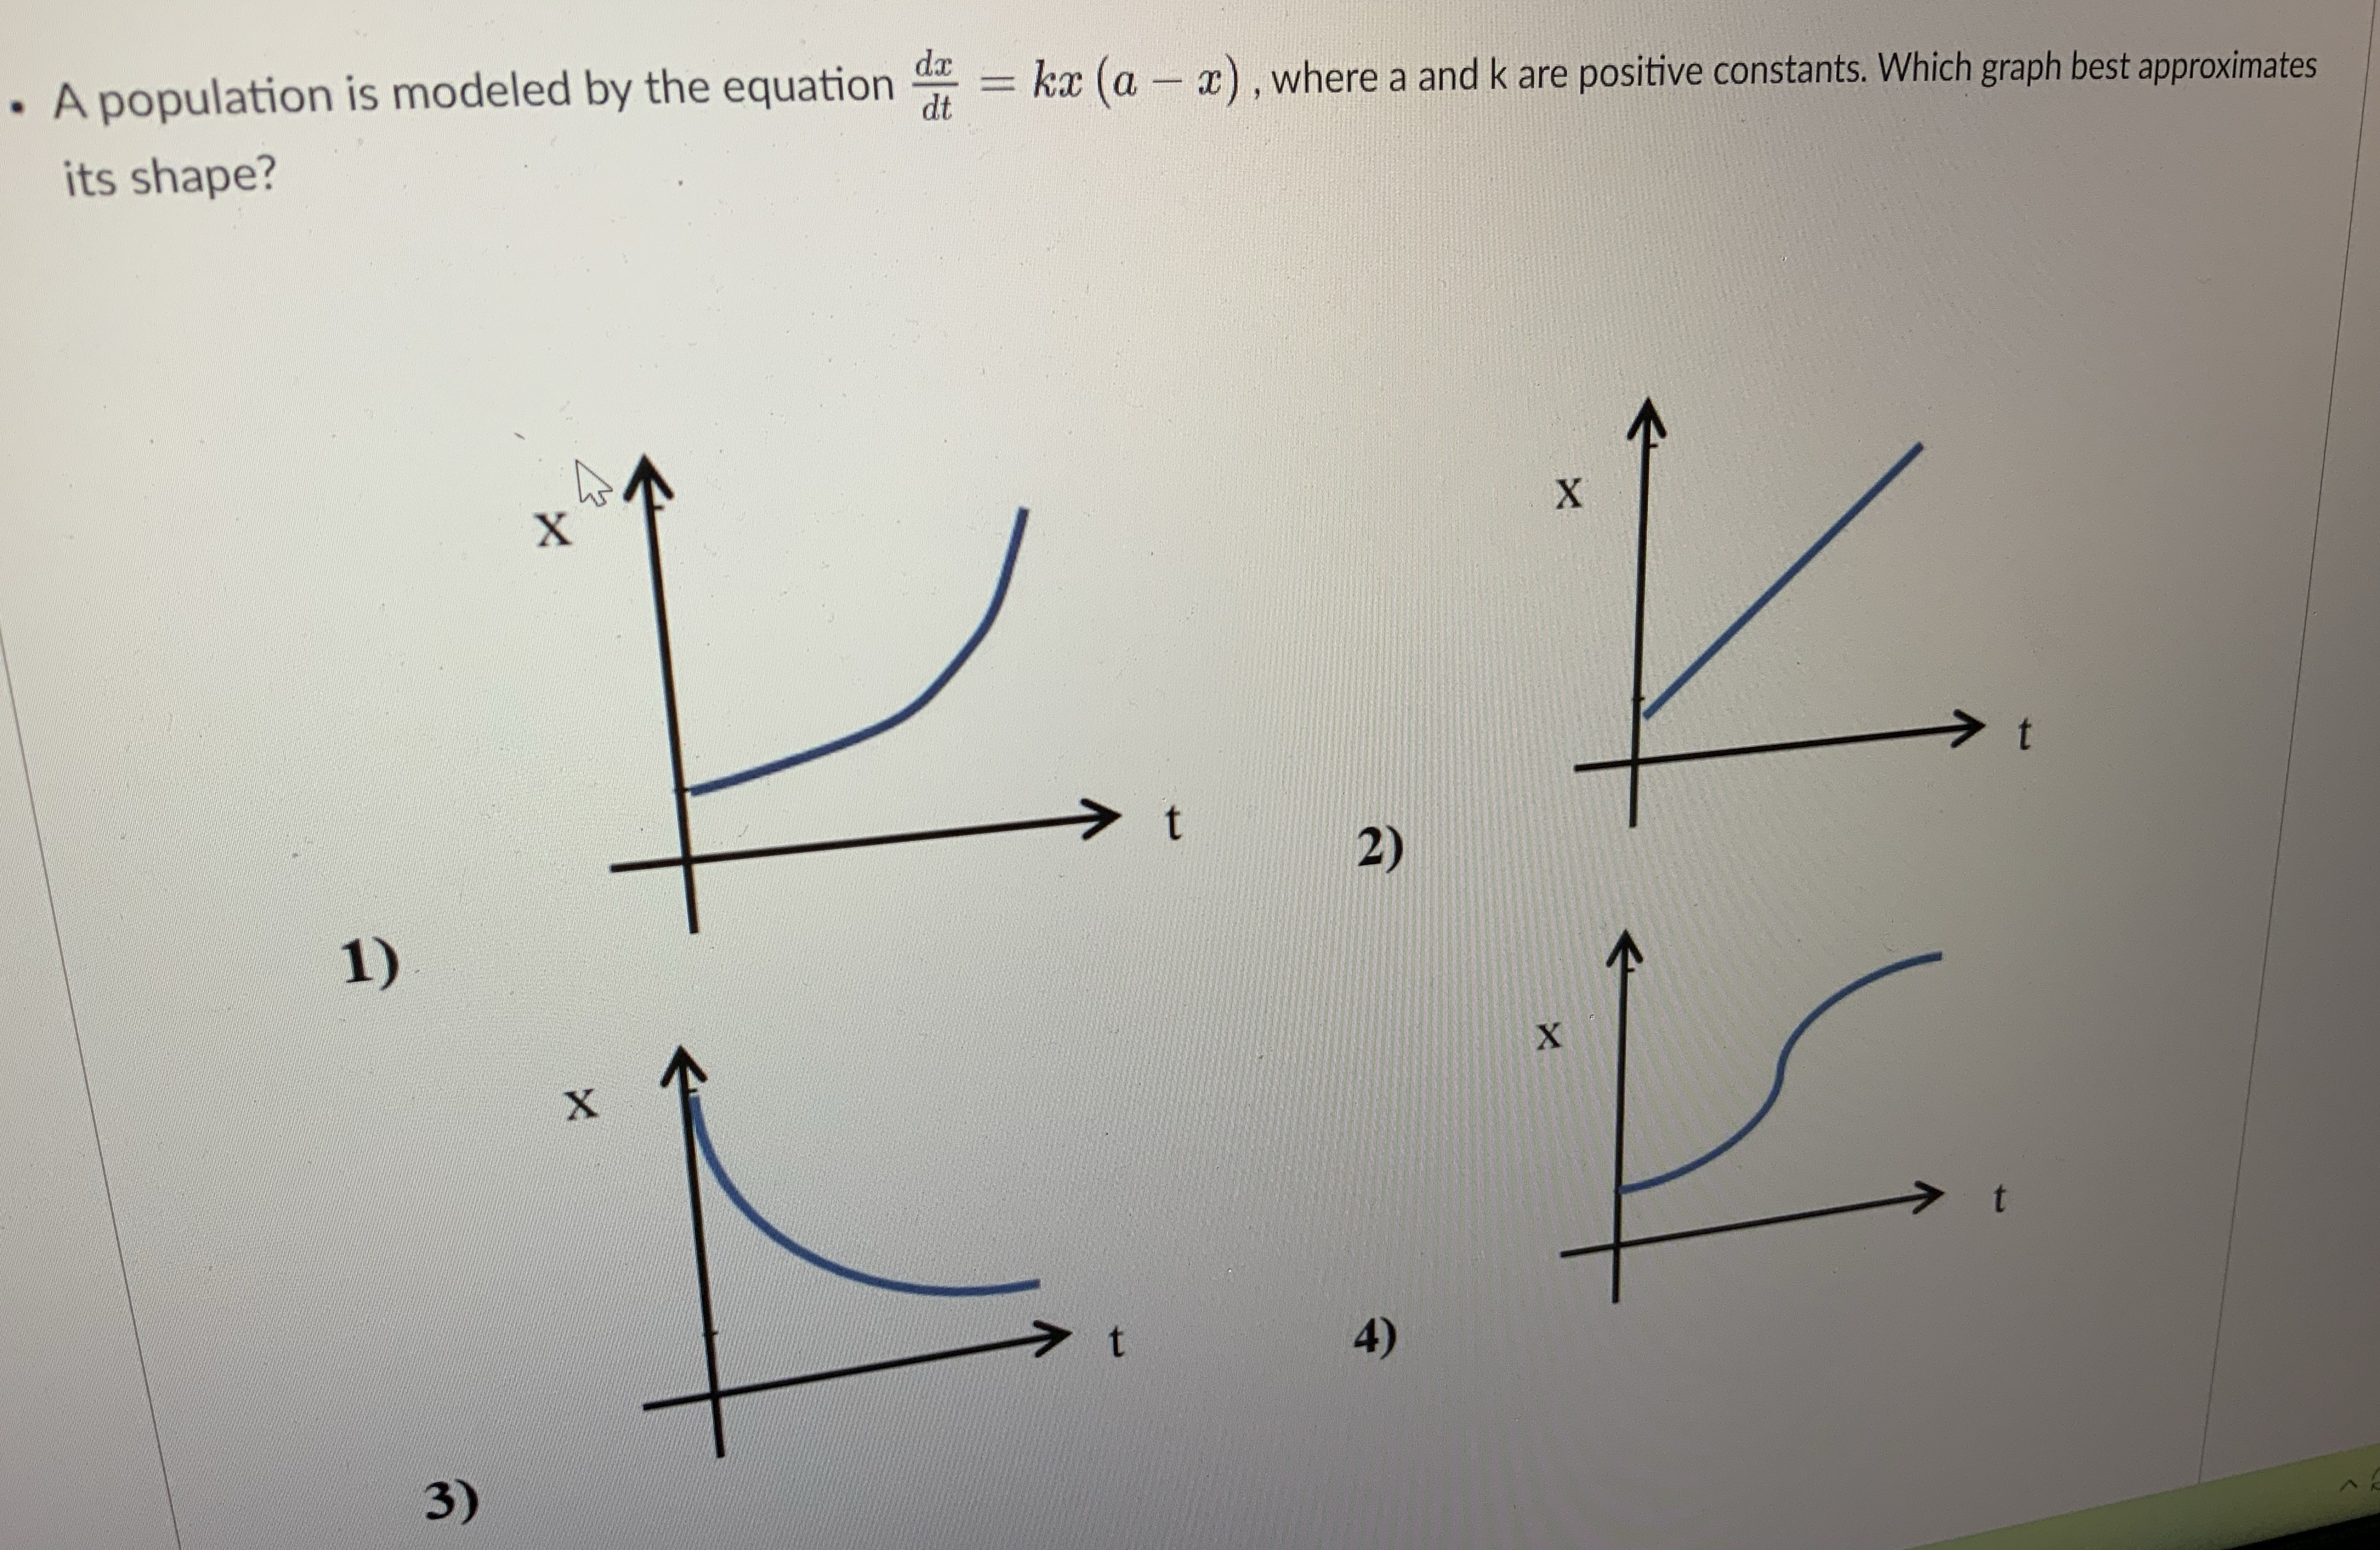
. A population is modeled by the equation da = ka (a - x) , where a and k are positive constants. Which graph best approximates its shape? X X t t 2) 1) X X t 4) 3)
Step by Step Solution
There are 3 Steps involved in it
1 Expert Approved Answer
Step: 1 Unlock

Question Has Been Solved by an Expert!
Get step-by-step solutions from verified subject matter experts
Step: 2 Unlock
Step: 3 Unlock