

Question: A portfolio manager summaries the input from the macro and micro forecasts in the following table: Calculate expected excess returns, alpha values, and residual variances
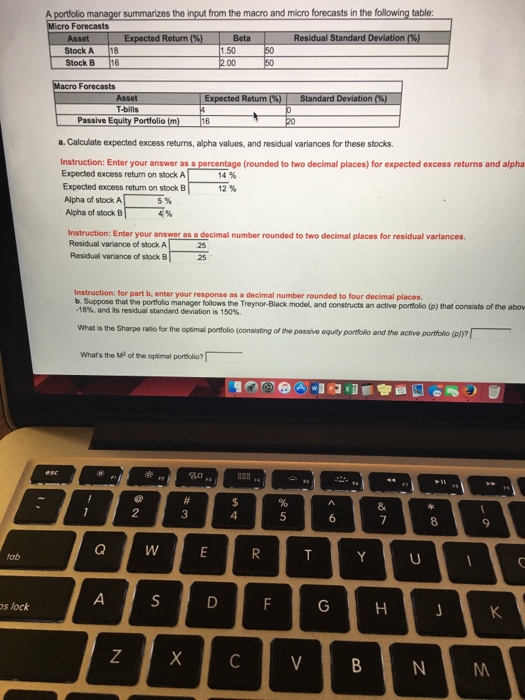
A portfolio manager summaries the input from the macro and micro forecasts in the following table: Calculate expected excess returns, alpha values, and residual variances for these stocks. Enter your answer as a percentage (rounded to two decimal places) for expected excess returns and alpha Expected excess return on stock A 14% Expected excess return on stock B 12% Alpha of stock A 5% Alpha of stock B 4% Enter your answer as a decimal number rounded to two decimal places for residual variances. Residual variance of stock A .25 Residual variance of stock A .25 Residual variance of stock B .25 for part b, enyour responses as a decimal number rounded to four decimal places. Suppose that the portfolio manager follows the Treynor-Black model, and constructs an active portfolio (P) that consists of the above -18%, and its residual standard deviation is 150%. What is the Sharpe ratio for the optimal portfolio (consisting of the passive equity portfolio and the active portfolio (P)? What's the M^2 of the optimal portfolio
Step by Step Solution
There are 3 Steps involved in it

Get step-by-step solutions from verified subject matter experts