

Question: A portfolio manager summarizes the input from the macro and micro forecasters in the following table: Micro Forecasts Expected Return(%) 20 18 17 12 Residual
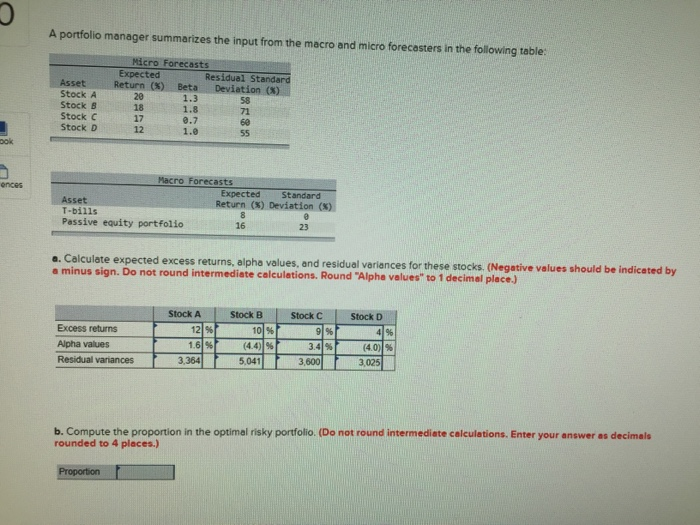

A portfolio manager summarizes the input from the macro and micro forecasters in the following table: Micro Forecasts Expected Return(%) 20 18 17 12 Residual Standa Asset Stock A Stock B Stock C Stock D Beta 1.3 1.8 0.7 1.0 Deviation (X)M 58 71 60 Macro Forecasts Expected Standard sset T-bills Passive equity portfolio Return (3) Deviation 16 23 a. Calculate expected excess returns, alpha values, and residual veriances for these stocks. (Negative values should be indicated by a minus sign. Do not round intermediste calculations. Round "Alphe values to 1 decimal place.) ues should be indicated by Stock A Stock B Stock C |Stock D Excess returns Alpha values Residual variances (4 41% 341% 3,364 3,600 b. Compute the proportion in the optimal risky portfolio. (Do not round intermediate calculations. Enter your answer as decimale rounded to 4 places.)
Step by Step Solution
There are 3 Steps involved in it

Get step-by-step solutions from verified subject matter experts