

Question: A portfolio manager summarizes the input from the macro and micro forecasters in the following table: 12 Micro Forecasts Residual Expected Standard Asset Return (8)
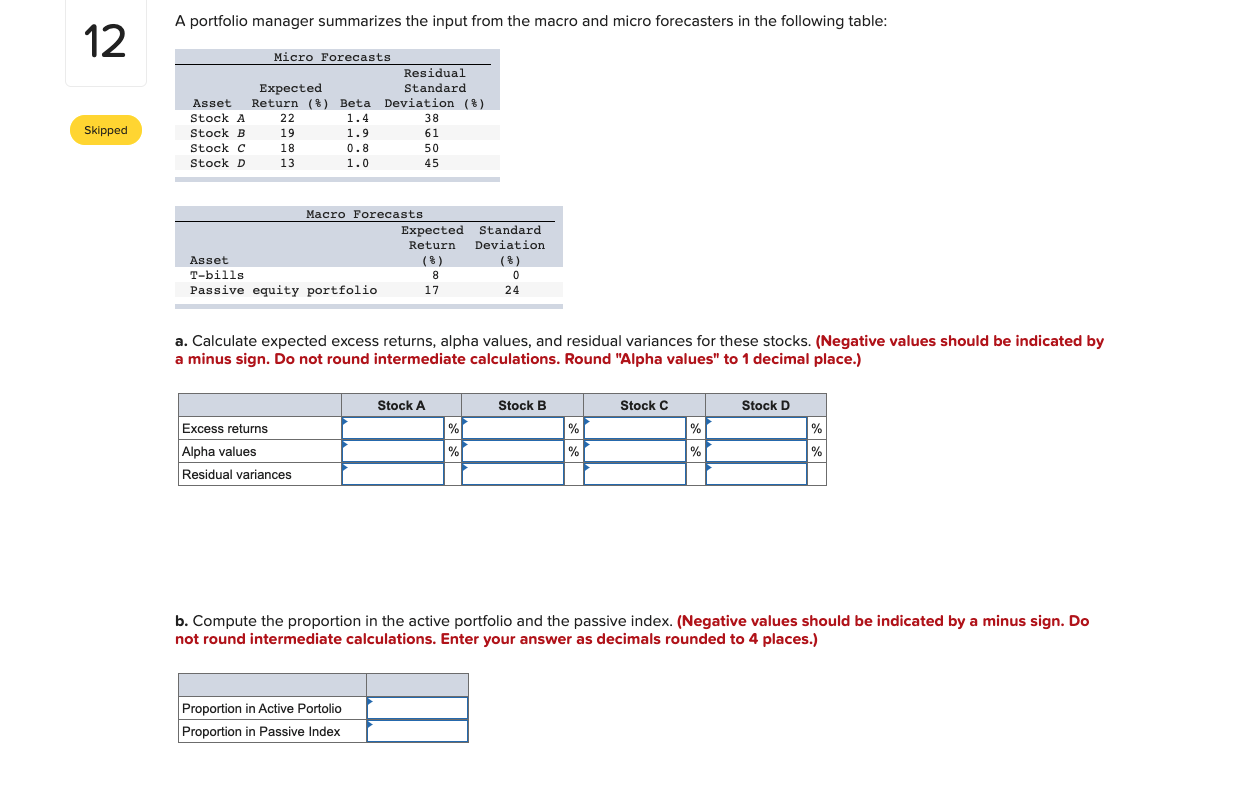
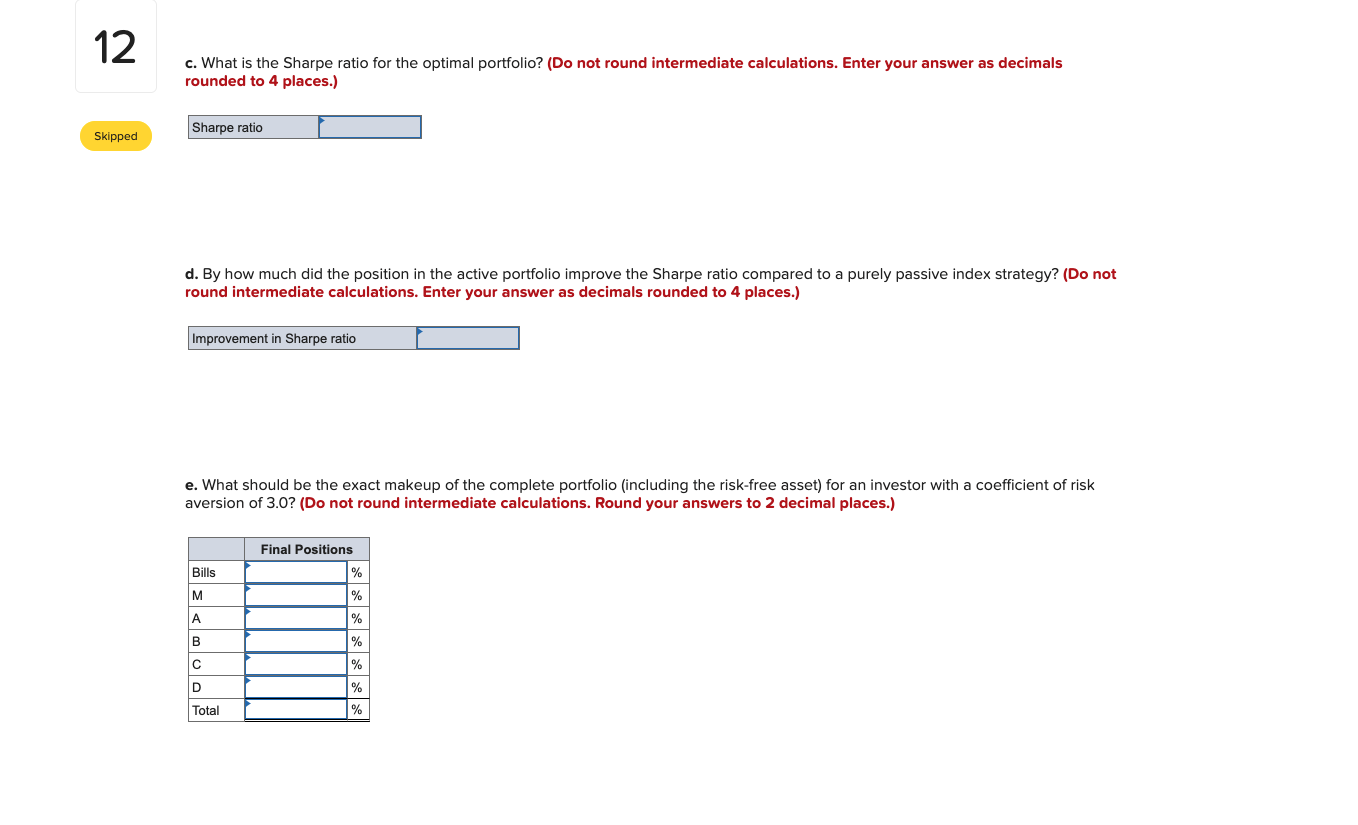
A portfolio manager summarizes the input from the macro and micro forecasters in the following table: 12 Micro Forecasts Residual Expected Standard Asset Return (8) Beta Deviation (%) Stock A 22 1.4 38 Stock B 19 1.9 61 Stock c C 18 0.8 50 Stock D 13 1.0 45 Skipped Macro Forecasts Expected Standard Return Deviation Asset T-bills - 8 0 Passive equity portfolio 17 24 a. Calculate expected excess returns, alpha values, and residual variances for these stocks. (Negative values should be indicated by a minus sign. Do not round intermediate calculations. Round "Alpha values" to 1 decimal place.) Stock A Stock B Stock C Stock D Excess returns % % % % % % % % Alpha values Residual variances b. Compute the proportion in the active portfolio and the passive index. (Negative values should be indicated by a minus sign. Do not round intermediate calculations. Enter your answer as decimals rounded to 4 places.) Proportion in Active Portolio Proportion in Passive Index 12 c. What is the Sharpe ratio for the optimal portfolio? (Do not round intermediate calculations. Enter your answer as decimals rounded to 4 places.) Sharpe ratio Skipped d. By how much did the position in the active portfolio improve the Sharpe ratio compared to a purely passive index strategy? (Do not round intermediate calculations. Enter your answer as decimals rounded to 4 places.) Improvement in Sharpe ratio e. What should be the exact makeup of the complete portfolio (including the risk-free asset) for an investor with a coefficient of risk aversion of 3.0? (Do not round intermediate calculations. Round your answers to 2 decimal places.) Final Positions Bills % M % A % B % % D % % Total A portfolio manager summarizes the input from the macro and micro forecasters in the following table: 12 Micro Forecasts Residual Expected Standard Asset Return (8) Beta Deviation (%) Stock A 22 1.4 38 Stock B 19 1.9 61 Stock c C 18 0.8 50 Stock D 13 1.0 45 Skipped Macro Forecasts Expected Standard Return Deviation Asset T-bills - 8 0 Passive equity portfolio 17 24 a. Calculate expected excess returns, alpha values, and residual variances for these stocks. (Negative values should be indicated by a minus sign. Do not round intermediate calculations. Round "Alpha values" to 1 decimal place.) Stock A Stock B Stock C Stock D Excess returns % % % % % % % % Alpha values Residual variances b. Compute the proportion in the active portfolio and the passive index. (Negative values should be indicated by a minus sign. Do not round intermediate calculations. Enter your answer as decimals rounded to 4 places.) Proportion in Active Portolio Proportion in Passive Index 12 c. What is the Sharpe ratio for the optimal portfolio? (Do not round intermediate calculations. Enter your answer as decimals rounded to 4 places.) Sharpe ratio Skipped d. By how much did the position in the active portfolio improve the Sharpe ratio compared to a purely passive index strategy? (Do not round intermediate calculations. Enter your answer as decimals rounded to 4 places.) Improvement in Sharpe ratio e. What should be the exact makeup of the complete portfolio (including the risk-free asset) for an investor with a coefficient of risk aversion of 3.0? (Do not round intermediate calculations. Round your answers to 2 decimal places.) Final Positions Bills % M % A % B % % D % % Total
Step by Step Solution
There are 3 Steps involved in it

Get step-by-step solutions from verified subject matter experts