

Question: A portfolio manager summarizes the input from the macro and micro forecasters in the following table: Micro Forecasts AssetExpected Return (%)BetaResidual Standard Deviation (%) Stock
A portfolio manager summarizes the input from the macro and micro forecasters in the following table:
Micro Forecasts AssetExpected Return (%)BetaResidual Standard Deviation (%) Stock A 24 1.2 64 Stock B 22 2.0 74 Stock C 21 0.8 63 Stock D 16 1.0 58
Macro Forecasts AssetExpected Return (%)Standard Deviation (%) T-bills 8 0 Passive equity portfolio 20 25
a. Calculate expected excess returns, alpha values, and residual variances for these stocks. (Negative values should be indicated by a minus sign. Do not round intermediate calculations. Round "Alpha values" to 1 decimal place.) 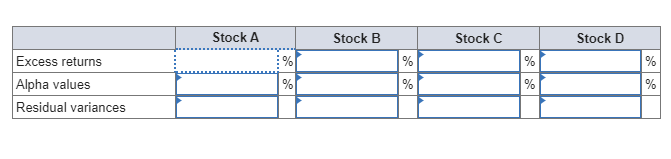 b. Compute the proportion in the active portfolio and the passive index. (Negative values should be indicated by a minus sign. Do not round intermediate calculations. Enter your answer as decimals rounded to 4 places.)
 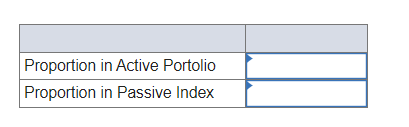 c. What is the Sharpe ratio for the optimal portfolio? (Do not round intermediate calculations. Enter your answer as decimals rounded to 4 places.)
 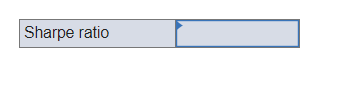 d. By how much did the position in the active portfolio improve the Sharpe ratio compared to a purely passive index strategy? (Do not round intermediate calculations. Enter your answer as decimals rounded to 4 places.)
 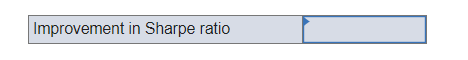 e. What should be the exact makeup of the complete portfolio (including the risk-free asset) for an investor with a coefficient of risk aversion of 3.0? (Do not round intermediate calculations. Round your answers to 2 decimal places.)
Improvement in Sharpe ratio \begin{tabular}{|l|l|} \hline & \\ \hline Proportion in Active Portolio \\ \hline Proportion in Passive Index \\ \hline \end{tabular} \begin{tabular}{|l|c|c|c|c|c|c|c|} \hline & Stock A & \multicolumn{2}{c|}{ Stock B } & \multicolumn{2}{c|}{ Stock C } & \multicolumn{2}{c|}{ Stock D } \\ \hline Excess returns & & % & & % & & % \\ \hline Alpha values & & % & & % & & % & \\ \hline Residual variances & & & % & & & & \\ \hline \end{tabular} \begin{tabular}{|l|l|l|} \hline & \multicolumn{2}{|c|}{ Final Positions } \\ \hline Bills & & % \\ \hline M & & % \\ \hline A & & % \\ \hline B & & % \\ \hline C & & % \\ \hline D & & % \\ \hline Total & & % \\ \hline \end{tabular} Sharpe ratio
Step by Step Solution
There are 3 Steps involved in it

Get step-by-step solutions from verified subject matter experts