

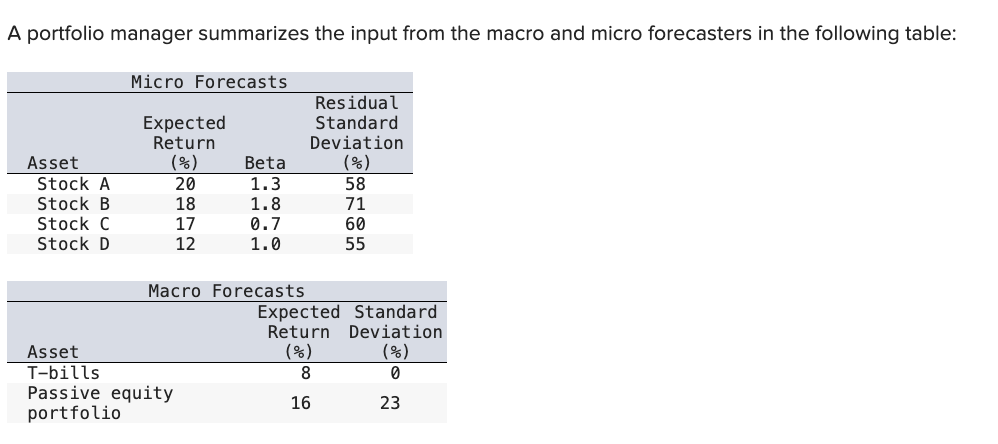
Question: A portfolio manager summarizes the input from the macro and micro forecasters in the following table ( in image below ) : Required: use Treynor
A portfolio manager summarizes the input from the macro and micro forecasters in the following table in image below:
Required: use TreynorBlack model
A Calculate expected excess returns, alpha values, and residual variances for these stocks.
B Proportion in total Active Portfolio:
Proportion in Passive Index:
C What is the Sharpe Ratio for the optimal portfolio?
D Compared to the Sharpe Ratio of a purely passive index, by how much did the position in the active portfolio improve the Sharpe ratio?
E What should be the exact makeup of the complete portfolio including the riskfree Tbills for an investor with a coefficient of risk aversion of
Note:
Do not round intermediate calculations. Round your answers to decimal places. Calculate using numbers in decimal form, not percentages. For example use for calculation if standard deviation is provided as All required problems are pictured below besides Requirement A Thank you for your help.
Step by Step Solution
There are 3 Steps involved in it
1 Expert Approved Answer
Step: 1 Unlock

Question Has Been Solved by an Expert!
Get step-by-step solutions from verified subject matter experts
Step: 2 Unlock
Step: 3 Unlock