

Question: A portfolio manager summarizes the input from the macro and micro forecasters in the following table 27 28 Stock A Stock B Stock 06 Expected
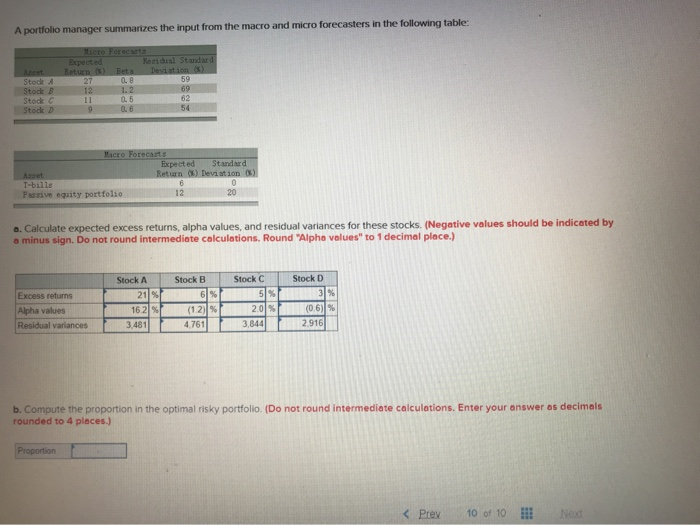
A portfolio manager summarizes the input from the macro and micro forecasters in the following table 27 28 Stock A Stock B Stock 06 Expected Standard Return ) Devision P T-bills rive equity portfolio a. Calculate expected excess returns, alpha values, and residual variances for these stocks. (Negative values should be indicated by a minus sign. Do not round Intermediate calculations. Round "Alpha values" to 1 decimal place.) Stock A Stock B Stock C Stock D Excess returns Alpha values Residual variances 380 b. Compute the proportion in the optimal risky portfolio. (Do not round intermediate calculations. Enter your answer as decimals rounded to 4 places.) Proportion
Step by Step Solution
There are 3 Steps involved in it

Get step-by-step solutions from verified subject matter experts