

Question: A portfolio with the given weights: generates a mean higher than the mean of each individual ticker exhibits an STD risk lower than the risk
A portfolio with the given weights:
- generates a mean higher than the mean of each individual ticker
- exhibits an STD risk lower than the risk of any individual ticker
- It can't be dominated by any portfolio providing its mean return
- answers 1 and 3 are correct
- all of the above
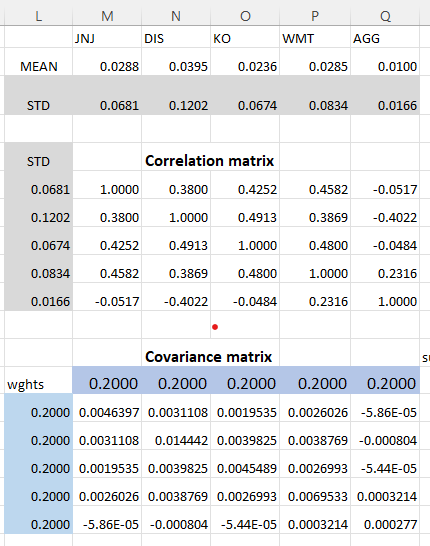
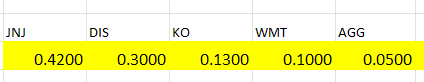
\begin{tabular}{|c|c|c|c|c|c|} \hline L & M & N & O & P & Q \\ \hline & JNJ & DIS & KO & WMT & AGG \\ \hline MEAN & 0.0288 & 0.0395 & 0.0236 & 0.0285 & 0.0100 \\ \hline STD & 0.0681 & 0.1202 & 0.0674 & 0.0834 & 0.0166 \\ \hline STD & & \multicolumn{2}{|c|}{ Correlation matrix } & & \\ \hline 0.0681 & 1.0000 & 0.3800 & 0.4252 & 0.4582 & -0.0517 \\ \hline 0.1202 & 0.3800 & 1.0000 & 0.4913 & 0.3869 & -0.4022 \\ \hline 0.0674 & 0.4252 & 0.4913 & 1.0000 & 0.4800 & -0.0484 \\ \hline 0.0834 & 0.4582 & 0.3869 & 0.4800 & 1.0000 & 0.2316 \\ \hline \multirow[t]{3}{*}{0.0166} & -0.0517 & -0.4022 & -0.0484 & 0.2316 & 1.0000 \\ \hline & & & - & & \\ \hline & & \multicolumn{2}{|c|}{ Covariance matrix } & & \\ \hline wghts & 0.2000 & 0.2000 & 0.2000 & 0.2000 & 0.2000 \\ \hline 0.2000 & 0.0046397 & 0.0031108 & 0.0019535 & 0.0026026 & 5.86E05 \\ \hline 0.2000 & 0.0031108 & 0.014442 & 0.0039825 & 0.0038769 & -0.000804 \\ \hline 0.2000 & 0.0019535 & 0.0039825 & 0.0045489 & 0.0026993 & 5.44E05 \\ \hline 0.2000 & 0.0026026 & 0.0038769 & 0.0026993 & 0.0069533 & 0.0003214 \\ \hline 0.2000 & 5.86E05 & -0.000804 & 5.44E05 & 0.0003214 & 0.000277 \\ \hline \end{tabular} \begin{tabular}{|c|c|c|c|c|} \hline JNJ & DIS & KO & WMT & AGG \\ \hline 0.4200 & 0.3000 & 0.1300 & 0.1000 & 0.0500 \\ \hline \end{tabular}
Step by Step Solution
There are 3 Steps involved in it

Get step-by-step solutions from verified subject matter experts