

Question: A pressure versus volume ( pV ) diagram for a system is mnea n illa icm a M shown in the figure. The arrows of
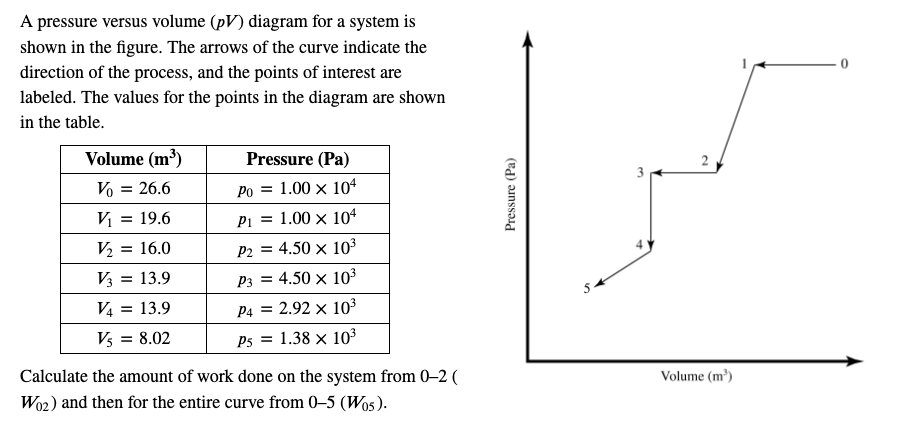
A pressure versus volume pV diagram for a system is
mnea
n
illa
icm
a
M
shown in the figure. The arrows of the curve indicate the direction of the process, and the points of interest are labeled.
The values for the points in the diagram are shown in the table.
Volume m
Pressure Pa
Vo
Po
V
P
V
P
V
P
V
P
V
Ps
Pressure
Calculate the amount of work done on the system from Woz and then for the entire curve from Wo
Step by Step Solution
There are 3 Steps involved in it
1 Expert Approved Answer
Step: 1 Unlock

Question Has Been Solved by an Expert!
Get step-by-step solutions from verified subject matter experts
Step: 2 Unlock
Step: 3 Unlock