

Question: A process is in control with = 70.1 and 5 = 1.2. The process specifications are at 70 3.2. The sample size n =
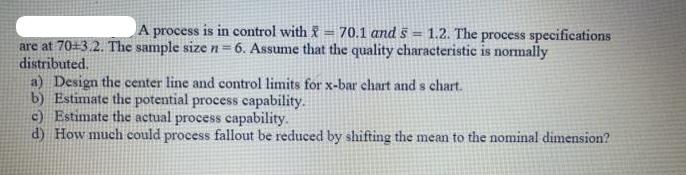
A process is in control with = 70.1 and 5 = 1.2. The process specifications are at 70 3.2. The sample size n = 6. Assume that the quality characteristic is normally distributed. a) Design the center line and control limits for x-bar chart and s chart. b) Estimate the potential process capability. c) Estimate the actual process capability. d) How much could process fallout be reduced by shifting the mean to the nominal dimension?
Step by Step Solution
3.45 Rating (161 Votes )
There are 3 Steps involved in it
We have x 701 cay x bas chart 3 LUL CL Central line D UCL D Zumi schast Xbae chast 1701 ... View full answer

Get step-by-step solutions from verified subject matter experts