

Question: A process that is assumed to be in control with limits of 89 + 2 had sample averages for the x-bar chart of the following:
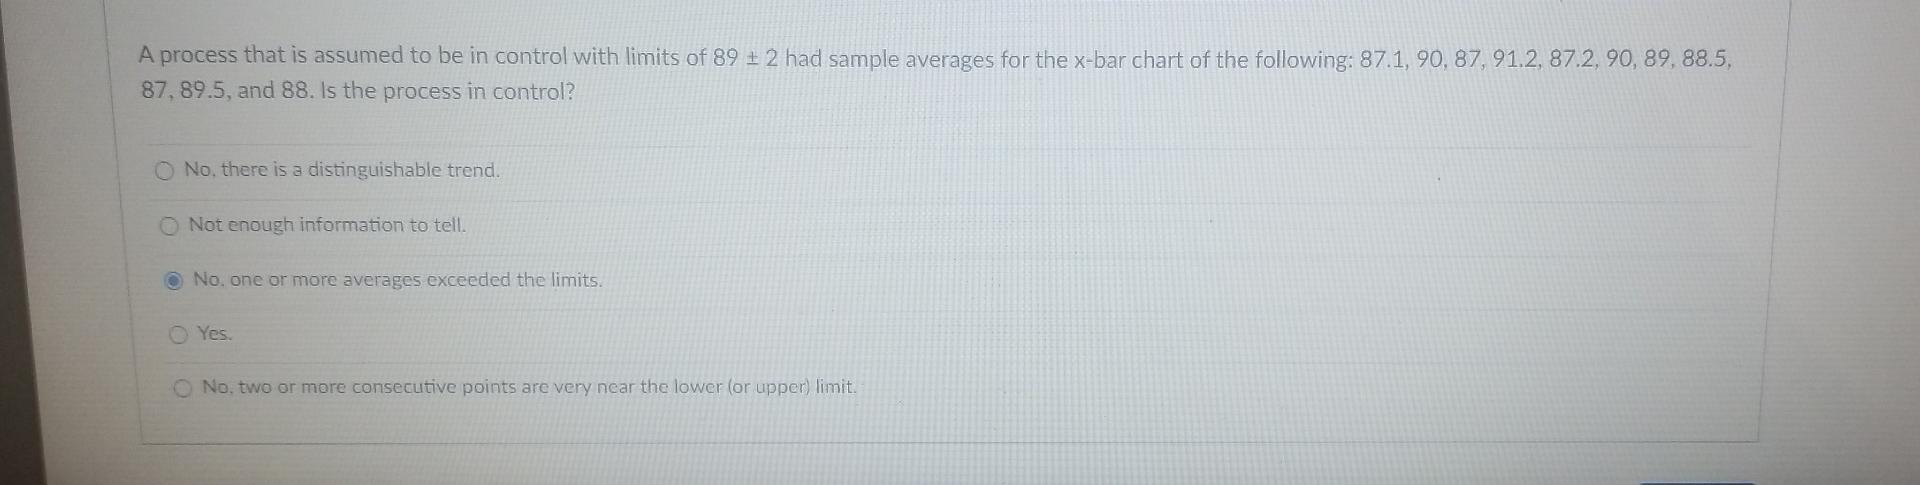
A process that is assumed to be in control with limits of 89 + 2 had sample averages for the x-bar chart of the following: 87.1, 90, 87, 91.2, 87.2, 90, 89, 88.5, 87,89.5, and 88. Is the process in control? No. there is a distinguishable trend. Not enough information to tell. No. one or more averages exceeded the limits. Yes. No, two or more consecutive points are very near the lower (or upper) limit
Step by Step Solution
There are 3 Steps involved in it
1 Expert Approved Answer
Step: 1 Unlock

Question Has Been Solved by an Expert!
Get step-by-step solutions from verified subject matter experts
Step: 2 Unlock
Step: 3 Unlock