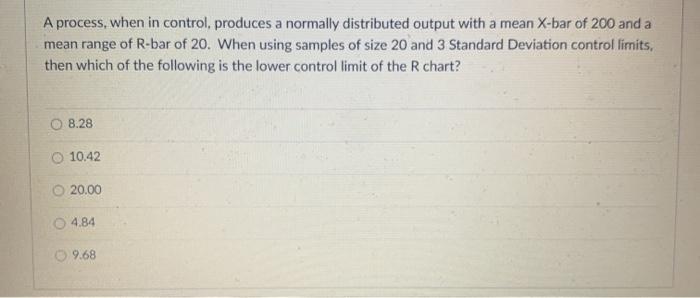
Question: A process, when in control, produces a normally distributed output with a mean X-bar of 200 and a mean range of R-bar of 20. When

A process, when in control, produces a normally
A process, when in control, produces a normally distributed output with a mean X-bar of 200 and a mean range of R-bar of 20. When using samples of size 20 and 3 Standard Deviation control limits, then which of the following is the lower controllimit of the R chart? 8.28 O 10.42 20.00 4.84 9.68

Step by Step Solution

There are 3 Steps involved in it

1 Expert Approved Answer
Step: 1 Unlock blur-text-image
Question Has Been Solved by an Expert!

Get step-by-step solutions from verified subject matter experts

Step: 2 Unlock
Step: 3 Unlock

Students Have Also Explored These Related General Management Questions!