

Question: A production process is designed to ll boxes with an average of 15 ounces of cereal. The population of lling weights is normally distributed with


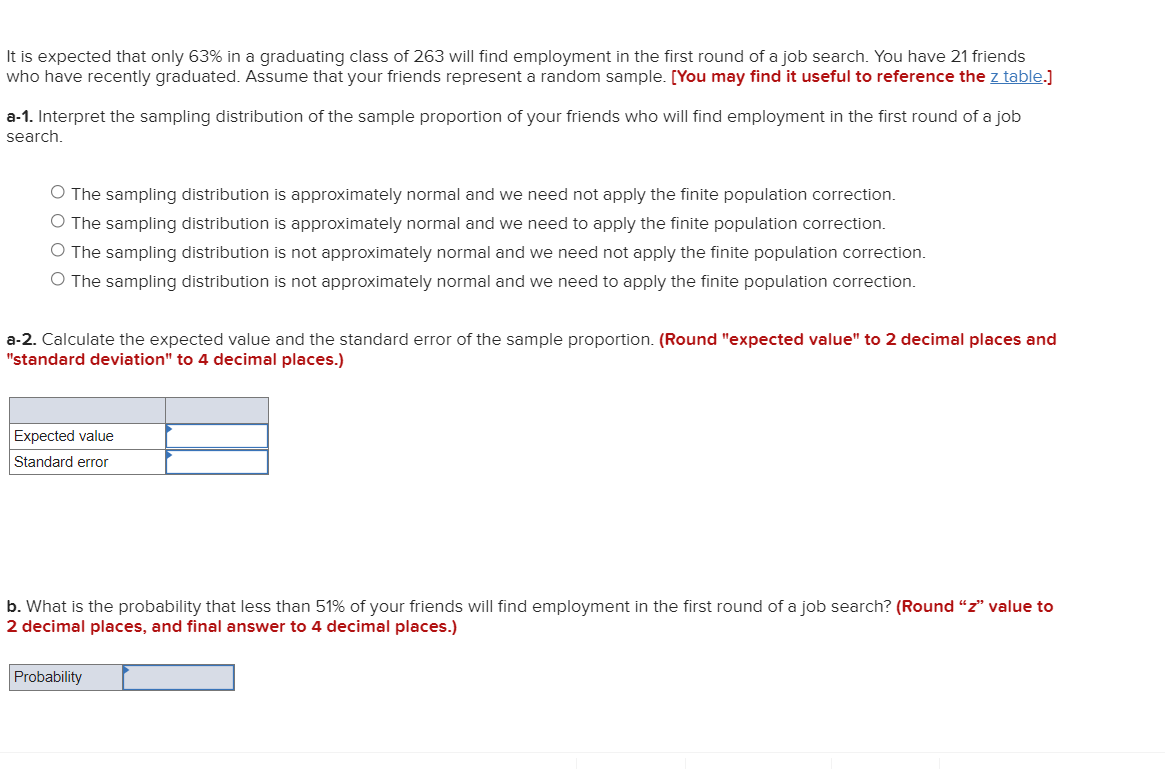
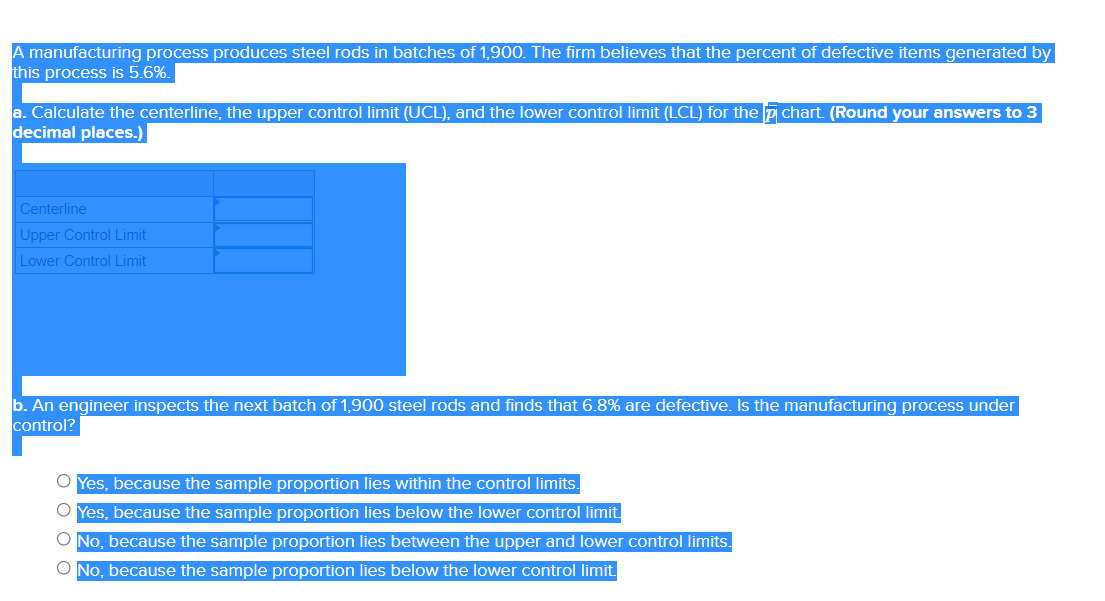
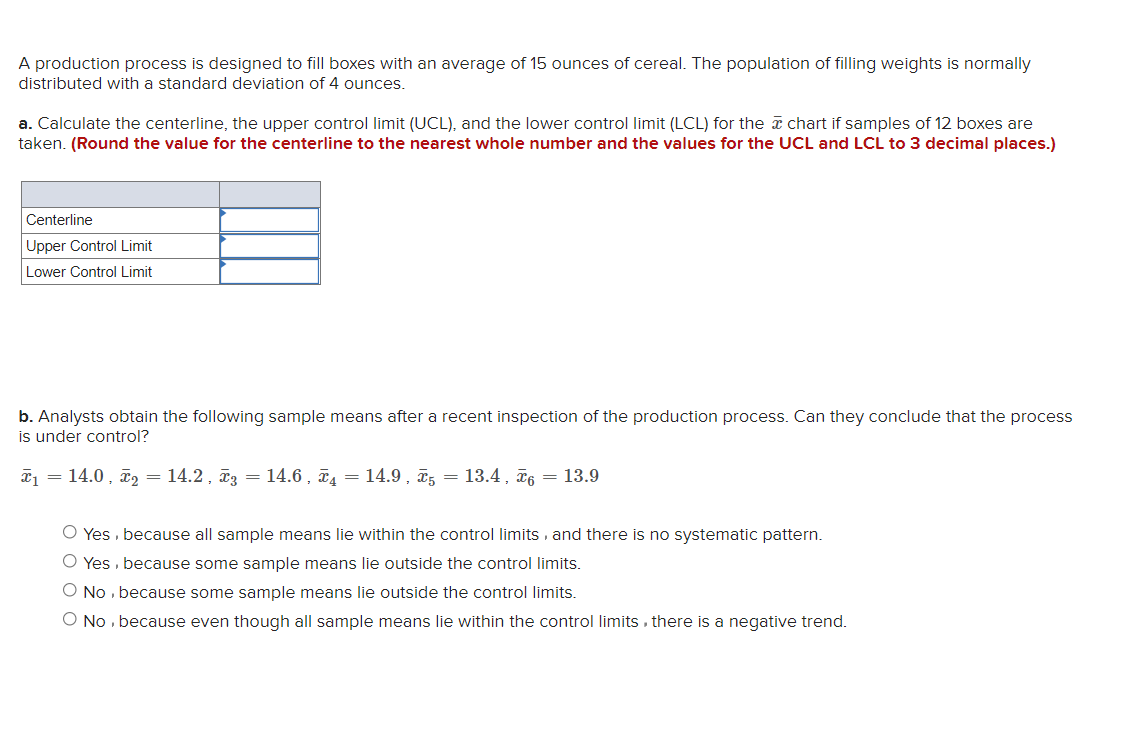
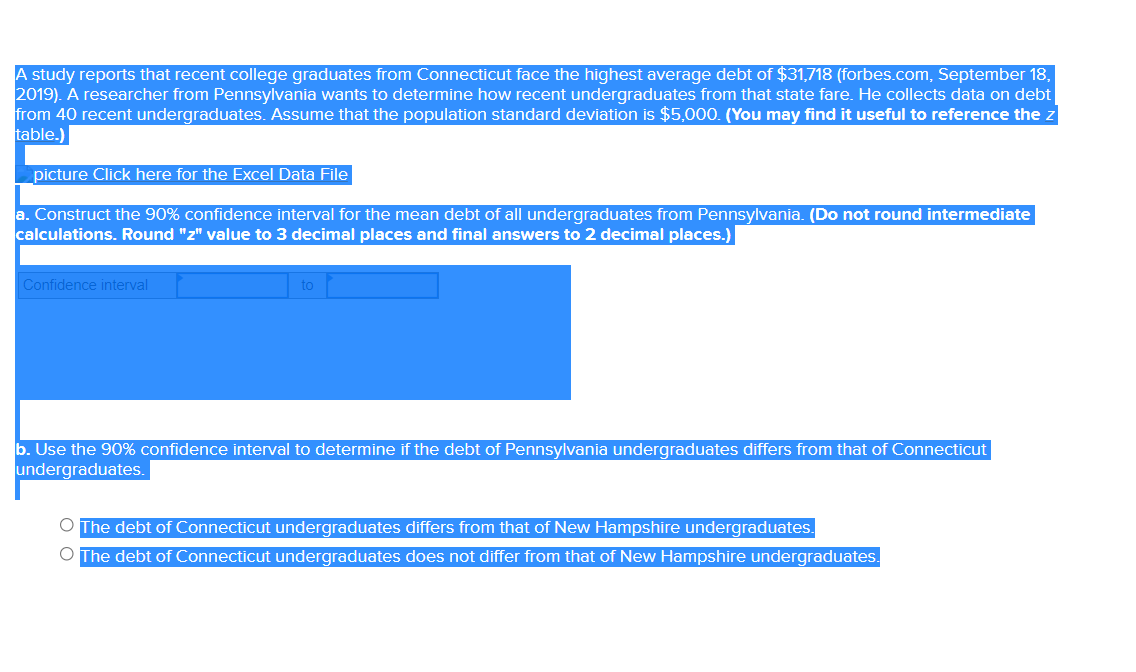


A production process is designed to ll boxes with an average of 15 ounces of cereal. The population of lling weights is normally distributed with a standard deviation of4 ounces. a. Calculate the centerline, the upper control limit (UCL), and the lower control limit (LCL) for the E chart if samples of12 boxes are taken. (Round the value for the centerline to the nearest whole number and the values for the UCL and LCL to 3 decimal places.) Centerline Upper Control Limit Lower Control Limit b. Analysts obtain the following sample means after a recent inspection of the production process. Can they conclude that the process is under control? a] = 14.0, $2 = 14.2 , 5:; = 14.6, :54 = 14.9, 55 = 13.4, 5:5 = 13.9 0 Yes . because all sample means lie within the control limits . and there is no systematic pattern. 0 Yes . because some sample means lie outside the control limits. 0 No . because some sample means lie outside the control limits. 0 No . because even though all sample means lie within the control limits . there is a negative trend. A study reports that recent college graduates from Connecticut face the highest average debt of $31,718 {forbes.com, September 18, 2019). A researcher from Pennsylvania wants to determine how recent undergraduates from that state fare. He collects data on debt rom 40 recent undergraduates. Assume that the population standard deviation is $5,000. {You may nd it useful to reference the 2 picture Click here for the Excel Data File a. Construct the 90% confidence interval for the mean debt of all undergraduates from Pennsylvania. [Do not round intermediate calculations. Round ''2" value to 3 decimal places and nal answers to 2 decimal places.) b. Use the 90% confidence interval to determine ifthe debt of Pennsylvania undergraduates differs from that of Connecticut undergraduates. he debt of ConnecticLIt undergraduates differs from that of New Hampshire undergraduates. he debt of ConnecticLIt undergraduates does not differ from that of New Hampshire undergraduates. ft is expected that only 63% in a graduating class of 263 will nd employment in the rst round of a job search. You have 21 friends who have recently graduated. Assume that your friends represent a random sample. [You may nd it useful to reference the 2 table.] a-1. Interpret the sampling distribution ofthe sample proportion of your friends who will nd employment in the rst round of a job search. 0 The sampling distribution is approximately normal and we need not apply the nite population correction. O The sampling distribution is approximately normal and we need to apply the nite population correction. O The sampling distribution is not approximately normal and we need not apply the nite population correction. O The sampling distribution is not approximately normal and we need to apply the nite population correction. a-2. Calculate the expected value and the standard error ofthe sample proportion. (Round \"expected value" to 2 decimal places and "standard deviation\" to 4 decimal places.) Expected value Standard error b. What is the probability that less than 51% of your friends will nd employment in the rst round of a job search? (Round \"2" value to 2 decimal places. and nal answer to 4 decimal places.) b. An engineer inspects the next batch of 1,900 steel rods and nds that 6.8% are defective. Is the manufacturing process under 0 Yes, because the sample proportion lies within the control limits. because the sample proportion lies below the lower control limit 0 No, because the sample proportion lies between the upper and lower control limits. O No, because the sample proportion lies below the lower control limit
Step by Step Solution
There are 3 Steps involved in it

Get step-by-step solutions from verified subject matter experts