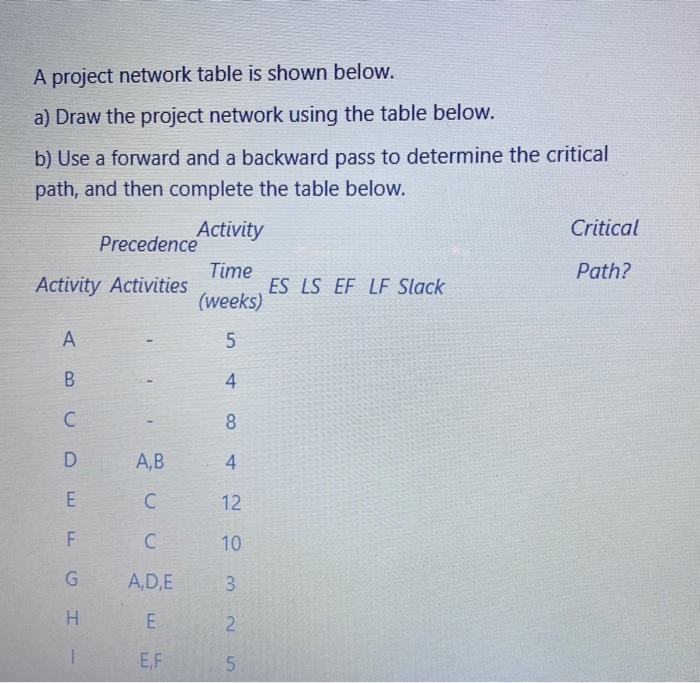
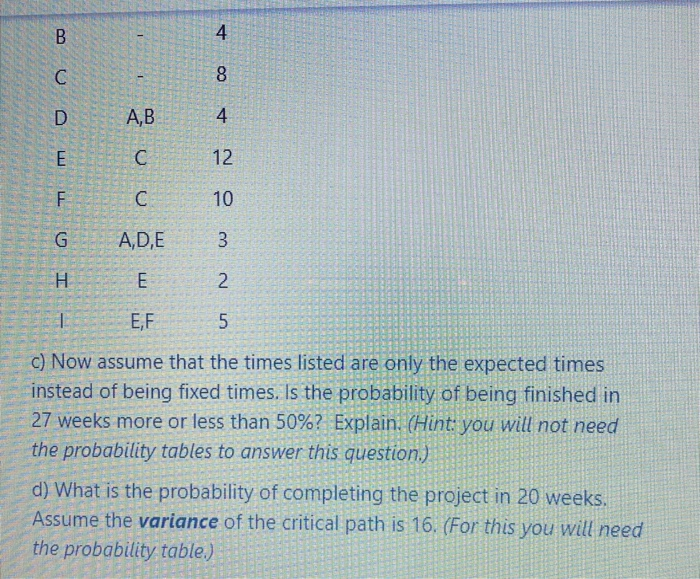
Question: A project network table is shown below. a) Draw the project network using the table below. b) Use a forward and a backward pass to

A project network table is shown below. a) Draw
A project network table is shown below. a) Draw the project network using the table below. b) Use a forward and a backward pass to determine the critical path, and then complete the table below. Critical Activity Precedence Times Activity Activities (weeks) S LS EF LF Slack Path? un e co A,B C - - Immo > 4 12 w A,D,E E 2 E,F in m no DO TO MICRO in w A c A GADE I RE IEF c) Now assume that the times listed are only the expected times instead of being fixed times. Is the probability of being finished in 27 weeks more or less than 50%? Explain. (Hint: you will not need the probability tables to answer this question.) d) What is the probability of completing the project in 20 weeks. Assume the variance of the critical path is 16. (For this you will need the probability table.)

Step by Step Solution

There are 3 Steps involved in it

1 Expert Approved Answer
Step: 1 Unlock blur-text-image
Question Has Been Solved by an Expert!

Get step-by-step solutions from verified subject matter experts

Step: 2 Unlock
Step: 3 Unlock

Students Have Also Explored These Related General Management Questions!